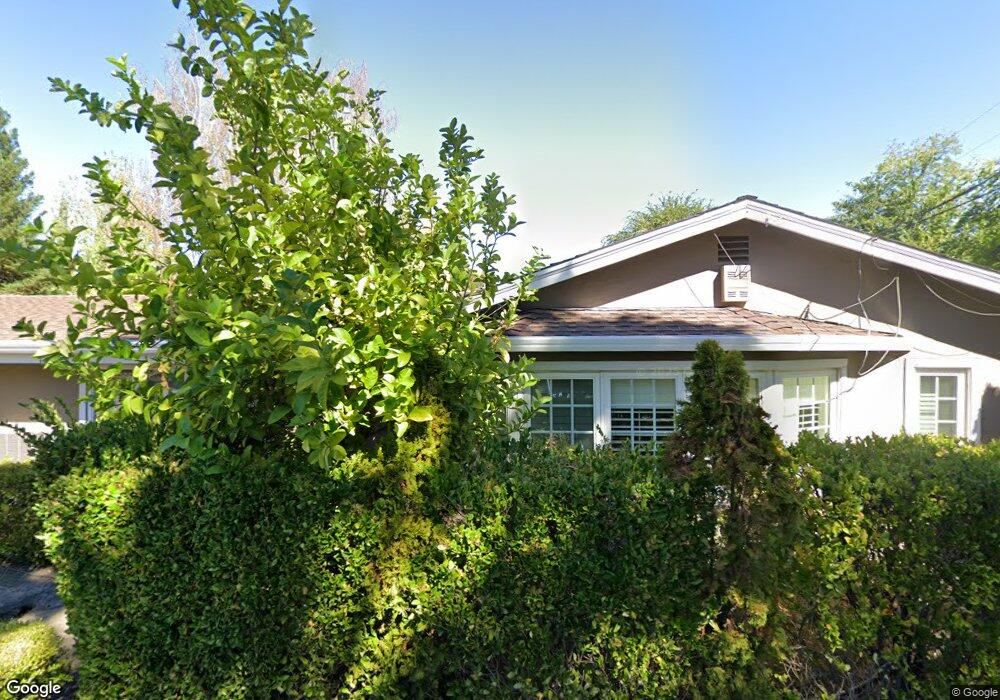
2795 Cherry Ln Walnut Creek, CA 94597
Contra Costa Centre NeighborhoodEstimated Value: $1,753,000 - $2,244,000
3
Beds
3
Baths
2,966
Sq Ft
$673/Sq Ft
Est. Value
About This Home
This home is located at 2795 Cherry Ln, Walnut Creek, CA 94597 and is currently estimated at $1,995,056, approximately $672 per square foot. 2795 Cherry Ln is a home located in Contra Costa County with nearby schools including Indian Valley Elementary School, Walnut Creek Intermediate School, and Las Lomas High School.
Ownership History
Date
Name
Owned For
Owner Type
Purchase Details
Closed on
Jun 23, 2020
Sold by
Ting Vivian
Bought by
Vivian Ting M D
Current Estimated Value
Home Financials for this Owner
Home Financials are based on the most recent Mortgage that was taken out on this home.
Original Mortgage
$900,000
Outstanding Balance
$632,693
Interest Rate
3.2%
Mortgage Type
New Conventional
Estimated Equity
$1,362,363
Purchase Details
Closed on
Jul 12, 2016
Sold by
Ting Vivian
Bought by
Ting Vivian
Home Financials for this Owner
Home Financials are based on the most recent Mortgage that was taken out on this home.
Original Mortgage
$50,000
Interest Rate
3.6%
Mortgage Type
Credit Line Revolving
Purchase Details
Closed on
Jun 11, 2015
Sold by
Ting Vivian
Bought by
Ting Md Vivian
Home Financials for this Owner
Home Financials are based on the most recent Mortgage that was taken out on this home.
Original Mortgage
$800,000
Interest Rate
3.77%
Mortgage Type
New Conventional
Purchase Details
Closed on
Sep 25, 2010
Sold by
Ting Vivian
Bought by
Ting M D Vivian
Home Financials for this Owner
Home Financials are based on the most recent Mortgage that was taken out on this home.
Original Mortgage
$674,500
Interest Rate
4.35%
Mortgage Type
New Conventional
Purchase Details
Closed on
Aug 18, 2008
Sold by
Ting Vivan
Bought by
Ting Md Vivian
Purchase Details
Closed on
Jun 10, 2008
Sold by
Essy Julia
Bought by
Ting Md Vivian
Home Financials for this Owner
Home Financials are based on the most recent Mortgage that was taken out on this home.
Original Mortgage
$160,000
Interest Rate
6.05%
Mortgage Type
Purchase Money Mortgage
Purchase Details
Closed on
Nov 20, 2006
Sold by
Essy Julia
Bought by
Essy Julia
Purchase Details
Closed on
Aug 19, 2005
Sold by
Essy Eddie
Bought by
Essy Julia
Home Financials for this Owner
Home Financials are based on the most recent Mortgage that was taken out on this home.
Original Mortgage
$600,000
Interest Rate
4.78%
Mortgage Type
Negative Amortization
Purchase Details
Closed on
Aug 15, 2005
Sold by
Whitacre James E and Whitacre Virginia C
Bought by
Essy Julia
Home Financials for this Owner
Home Financials are based on the most recent Mortgage that was taken out on this home.
Original Mortgage
$600,000
Interest Rate
4.78%
Mortgage Type
Negative Amortization
Purchase Details
Closed on
Mar 13, 2001
Sold by
Whitacre James E and Whitacre Virginia C
Bought by
Whitacre James E and Whitacre Virginia C
Create a Home Valuation Report for This Property
The Home Valuation Report is an in-depth analysis detailing your home's value as well as a comparison with similar homes in the area
Home Values in the Area
Average Home Value in this Area
Purchase History
| Date | Buyer | Sale Price | Title Company |
|---|---|---|---|
| Vivian Ting M D | -- | Chicago Title Company | |
| Ting Vivian | -- | Chicago Title Company | |
| Ting Vivian | -- | Old Republic Title Company | |
| Ting Vivian | -- | Old Republic Title Company | |
| Ting Md Vivian | -- | First American Title Company | |
| Ting Vivian | -- | First American Title Company | |
| Ting M D Vivian | -- | None Available | |
| Ting Vivian | -- | None Available | |
| Ting Md Vivian | -- | None Available | |
| Ting Md Vivian | $1,030,000 | Chicago Title Company | |
| Essy Julia | -- | None Available | |
| Essy Julia | -- | Placer Title | |
| Essy Julia | $1,017,000 | Placer Title | |
| Whitacre James E | -- | -- |
Source: Public Records
Mortgage History
| Date | Status | Borrower | Loan Amount |
|---|---|---|---|
| Open | Ting Vivian | $900,000 | |
| Closed | Ting Vivian | $50,000 | |
| Closed | Ting Vivian | $800,000 | |
| Previous Owner | Ting Vivian | $674,500 | |
| Previous Owner | Ting Md Vivian | $160,000 | |
| Previous Owner | Essy Julia | $600,000 |
Source: Public Records
Tax History Compared to Growth
Tax History
| Year | Tax Paid | Tax Assessment Tax Assessment Total Assessment is a certain percentage of the fair market value that is determined by local assessors to be the total taxable value of land and additions on the property. | Land | Improvement |
|---|---|---|---|---|
| 2025 | $15,830 | $1,352,908 | $735,560 | $617,348 |
| 2024 | $15,456 | $1,326,382 | $721,138 | $605,244 |
| 2023 | $15,456 | $1,300,376 | $706,999 | $593,377 |
| 2022 | $15,115 | $1,274,880 | $693,137 | $581,743 |
| 2021 | $14,709 | $1,249,884 | $679,547 | $570,337 |
| 2019 | $14,425 | $1,212,814 | $659,393 | $553,421 |
| 2018 | $13,940 | $1,189,034 | $646,464 | $542,570 |
| 2017 | $13,693 | $1,165,721 | $633,789 | $531,932 |
| 2016 | $13,448 | $1,142,864 | $621,362 | $521,502 |
| 2015 | $13,149 | $1,125,698 | $612,029 | $513,669 |
| 2014 | -- | $928,000 | $504,543 | $423,457 |
Source: Public Records
Map
Nearby Homes
- 2716 Oak Rd Unit 117
- 2716 Oak Rd Unit 111
- 100 Alderwood Rd
- 1060 Sheppard Rd
- 2724 Oak Rd Unit 88
- 2712 Oak Rd Unit 57
- 2712 Oak Rd Unit 60
- 2704 Oak Rd Unit 80
- 1053 Northoak Dr
- 2735 Oak Rd
- 2709 Oak Rd Unit H
- 2708 Oak Rd Unit 9
- 178 Oak Cir
- Plan 4X at Oak Grove
- Plan 6 at Oak Grove
- Plan 3 at Oak Grove
- Plan 5 at Oak Grove
- Plan 6X at Oak Grove
- Plan 5X at Oak Grove
- 225 Oak Cir
- 2771 Cherry Ln
- 1229 Elmwood Dr
- 2797 Cherry Ln
- 2759 Cherry Ln
- 1219 Elmwood Dr
- 2763 Cherry Ln
- 1245 Elmwood Dr
- 2755 Cherry Ln
- 1209 Elmwood Dr
- 20 Ravenwood Dr
- 2751 Cherry Ln
- 30 Ravenwood Dr
- 10 Ravenwood Dr
- 2741 Cherry Ln
- 1220 Elmwood Dr
- 1230 Elmwood Dr
- 40 Ravenwood Dr
- Pcl. B Cherry Ln
- 1210 Elmwood Dr
- 1240 Elmwood Dr