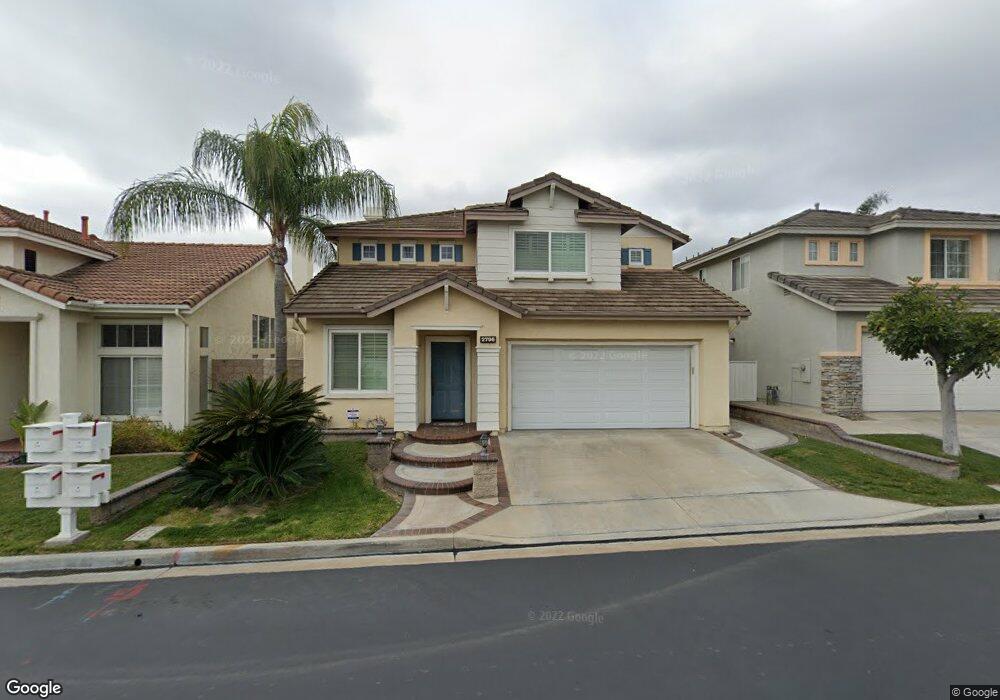
2796 N Surrey St Orange, CA 92867
Estimated Value: $1,169,822 - $1,378,000
4
Beds
3
Baths
1,932
Sq Ft
$657/Sq Ft
Est. Value
About This Home
This home is located at 2796 N Surrey St, Orange, CA 92867 and is currently estimated at $1,268,706, approximately $656 per square foot. 2796 N Surrey St is a home located in Orange County with nearby schools including Nohl Canyon Elementary School, Cerro Villa Middle School, and Villa Park High School.
Ownership History
Date
Name
Owned For
Owner Type
Purchase Details
Closed on
Dec 20, 2019
Sold by
Shah Ashok R and Shah Suhasben A
Bought by
Rshah Ashok and Shah Rlt Rlt A
Current Estimated Value
Purchase Details
Closed on
Jan 26, 2012
Sold by
Shah Ashok R and Shah Suhas A
Bought by
Shah Ashok R and Shah Suhasben A
Home Financials for this Owner
Home Financials are based on the most recent Mortgage that was taken out on this home.
Original Mortgage
$106,000
Interest Rate
3.85%
Mortgage Type
New Conventional
Purchase Details
Closed on
Aug 3, 1995
Sold by
Pacific Ridge Partners
Bought by
Shah Ashok R and Shah Suhas A
Home Financials for this Owner
Home Financials are based on the most recent Mortgage that was taken out on this home.
Original Mortgage
$165,200
Interest Rate
7.67%
Create a Home Valuation Report for This Property
The Home Valuation Report is an in-depth analysis detailing your home's value as well as a comparison with similar homes in the area
Home Values in the Area
Average Home Value in this Area
Purchase History
| Date | Buyer | Sale Price | Title Company |
|---|---|---|---|
| Rshah Ashok | -- | None Available | |
| Shah Ashok R | -- | Equity Title Company | |
| Shah Ashok R | $236,000 | First American Title Ins Co |
Source: Public Records
Mortgage History
| Date | Status | Borrower | Loan Amount |
|---|---|---|---|
| Closed | Shah Ashok R | $106,000 | |
| Previous Owner | Shah Ashok R | $165,200 |
Source: Public Records
Tax History Compared to Growth
Tax History
| Year | Tax Paid | Tax Assessment Tax Assessment Total Assessment is a certain percentage of the fair market value that is determined by local assessors to be the total taxable value of land and additions on the property. | Land | Improvement |
|---|---|---|---|---|
| 2025 | $4,409 | $394,607 | $95,846 | $298,761 |
| 2024 | $4,409 | $386,870 | $93,967 | $292,903 |
| 2023 | $4,308 | $379,285 | $92,125 | $287,160 |
| 2022 | $4,222 | $371,849 | $90,319 | $281,530 |
| 2021 | $4,105 | $364,558 | $88,548 | $276,010 |
| 2020 | $4,066 | $360,820 | $87,640 | $273,180 |
| 2019 | $4,015 | $353,746 | $85,922 | $267,824 |
| 2018 | $3,953 | $346,810 | $84,237 | $262,573 |
| 2017 | $3,864 | $340,010 | $82,585 | $257,425 |
| 2016 | $3,791 | $333,344 | $80,966 | $252,378 |
| 2015 | $3,735 | $328,337 | $79,749 | $248,588 |
| 2014 | $3,656 | $321,906 | $78,187 | $243,719 |
Source: Public Records
Map
Nearby Homes
- 2785 N Rochester Dr Unit B
- 2811 N Roxbury St
- 4330 E Cornwall Ave
- 2528 N San Miguel Dr
- 5470 E Big Sky Ln
- 5291 E Rural Ridge Cir
- 18781 Peppertree Dr
- 18732 Monte Vista Cir
- 5409 E Willowick Cir
- 580 S Londerry Ln
- 5353 E Rural Ridge Cir
- 595 S Avenida Faro
- 420 S Rolling Hills Place
- 18675 Valley Dr
- 18671 Valley Dr
- 581 S Paseo Carmel
- 9451 Brewer Way
- 4410 E Ardmore St
- 463 S Westridge Cir
- 480 S Avenida Faro
- 2802 N Surrey St
- 2788 N Surrey St
- 4922 E Leeds Ave
- 2782 N Surrey St
- 4926 E Ashford Ave
- 4918 E Leeds Ave
- 4932 E Leeds Ave
- 4920 E Ashford Ave
- 2797 N Surrey St
- 2789 N Surrey St
- 2803 N Surrey St
- 2776 N Surrey St
- 4912 E Ashford Ave
- 4910 E Leeds Ave
- 2783 N Surrey St
- 2809 N Surrey St
- 4931 E Leeds Ave
- 4848 E Ashford Ave
- 2770 N Surrey St
- 2775 N Surrey St