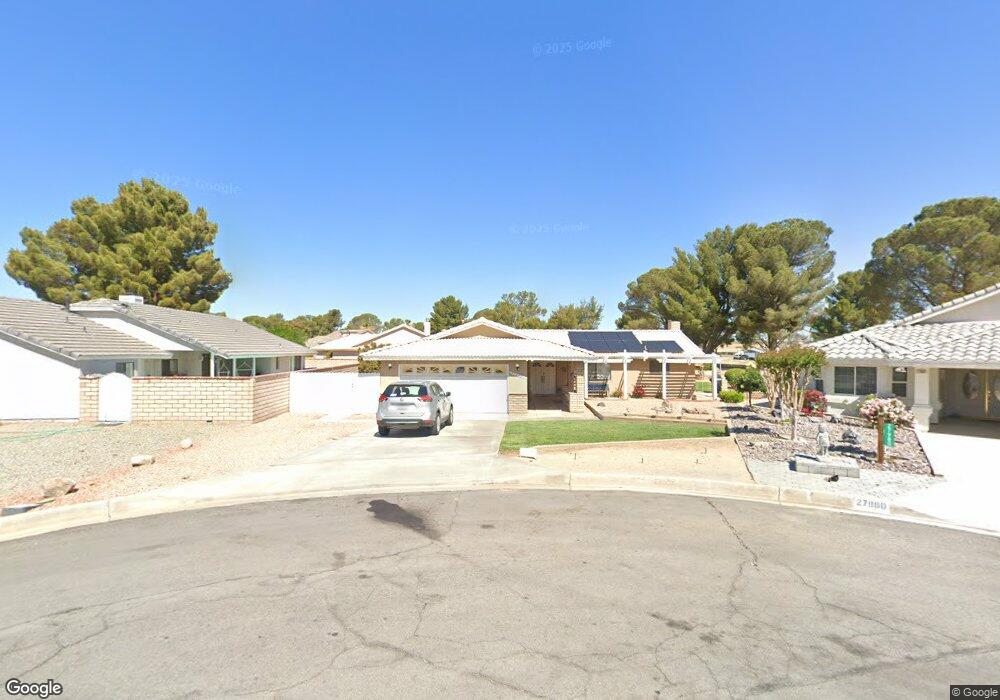
27976 Rustic Ct Helendale, CA 92342
Estimated Value: $312,668 - $424,000
3
Beds
2
Baths
1,550
Sq Ft
$228/Sq Ft
Est. Value
About This Home
This home is located at 27976 Rustic Ct, Helendale, CA 92342 and is currently estimated at $353,167, approximately $227 per square foot. 27976 Rustic Ct is a home located in San Bernardino County with nearby schools including Helendale Elementary School, Riverview Middle School, and Adelanto High School.
Ownership History
Date
Name
Owned For
Owner Type
Purchase Details
Closed on
Mar 31, 2020
Sold by
Casaus Lorrie D
Bought by
Estrada Joseph G
Current Estimated Value
Home Financials for this Owner
Home Financials are based on the most recent Mortgage that was taken out on this home.
Original Mortgage
$220,202
Outstanding Balance
$195,802
Interest Rate
3.6%
Mortgage Type
New Conventional
Estimated Equity
$157,365
Purchase Details
Closed on
Jul 7, 2015
Sold by
Monteith Robert Gene and Monteith Florence K
Bought by
Casaus Lorrie D
Home Financials for this Owner
Home Financials are based on the most recent Mortgage that was taken out on this home.
Original Mortgage
$151,650
Interest Rate
3.98%
Mortgage Type
New Conventional
Purchase Details
Closed on
Jul 22, 1996
Sold by
Monteith Robert G and Monteith Florence K
Bought by
Monteith 1996 Family Trust
Create a Home Valuation Report for This Property
The Home Valuation Report is an in-depth analysis detailing your home's value as well as a comparison with similar homes in the area
Home Values in the Area
Average Home Value in this Area
Purchase History
| Date | Buyer | Sale Price | Title Company |
|---|---|---|---|
| Estrada Joseph G | $218,000 | First American Title Company | |
| Casaus Lorrie D | $170,000 | First American Title Company | |
| Monteith 1996 Family Trust | -- | -- |
Source: Public Records
Mortgage History
| Date | Status | Borrower | Loan Amount |
|---|---|---|---|
| Open | Estrada Joseph G | $220,202 | |
| Previous Owner | Casaus Lorrie D | $151,650 |
Source: Public Records
Tax History
| Year | Tax Paid | Tax Assessment Tax Assessment Total Assessment is a certain percentage of the fair market value that is determined by local assessors to be the total taxable value of land and additions on the property. | Land | Improvement |
|---|---|---|---|---|
| 2025 | $3,249 | $238,417 | $47,684 | $190,733 |
| 2024 | $3,033 | $233,742 | $46,749 | $186,993 |
| 2023 | $3,011 | $229,158 | $45,832 | $183,326 |
| 2022 | $2,972 | $224,664 | $44,933 | $179,731 |
| 2021 | $2,917 | $220,259 | $44,052 | $176,207 |
| 2020 | $2,455 | $184,013 | $36,803 | $147,210 |
| 2019 | $2,431 | $180,405 | $36,081 | $144,324 |
| 2018 | $2,526 | $176,868 | $35,374 | $141,494 |
| 2017 | $2,352 | $173,400 | $34,680 | $138,720 |
| 2016 | $2,326 | $170,000 | $34,000 | $136,000 |
| 2015 | $1,874 | $145,000 | $35,000 | $110,000 |
| 2014 | -- | $126,500 | $46,000 | $80,500 |
Source: Public Records
Map
Nearby Homes
- 15114 Blue Grass Dr
- 15163 Blue Grass Dr
- 15047 Blue Grass Dr
- 15103 Tournament Dr
- 14907 Tournament Dr
- 15224 Little Bow Ln
- 15224 Tournament Dr
- 15036 Tournament Dr
- 14988 Blue Grass Dr
- 14989 Blue Grass Dr
- 27857 Hummingbird Ln
- 15082 Orchard Hill
- 27871 Jasmine Ln
- 15200 Wildflower Ln
- 14740 Blue Grass Dr
- 15190 Wildflower Ln
- 14743 Blue Grass Dr
- 14805 Greenbriar Dr
- 27392 Cloverleaf Dr
- 14666 Coolglen Dr
- 15128 Blue Grass Dr
- 15128 Blue Grass Dr Unit 1704
- 27980 Rustic Ct
- 27525 Sunset Ct
- 0 Sunset Ct
- 15106 Blue Grass Dr
- 27979 Rustic Ct
- 27973 Rustic Ct
- 27965 Rustic Ct
- 27960 Sunset Ct
- 27953 Sunset Ct
- 15137 Blue Grass Dr
- 0 Sunset View Unit C08144828
- 0 Sunset View Unit 57592
- 0 Sunset View Unit 57593
- 27986 Golf Ct
- 27972 Golf Ct
- 27954 Sunset Ct
- 15145 Blue Grass Dr
- 15155 Blue Grass Dr
Your Personal Tour Guide
Ask me questions while you tour the home.