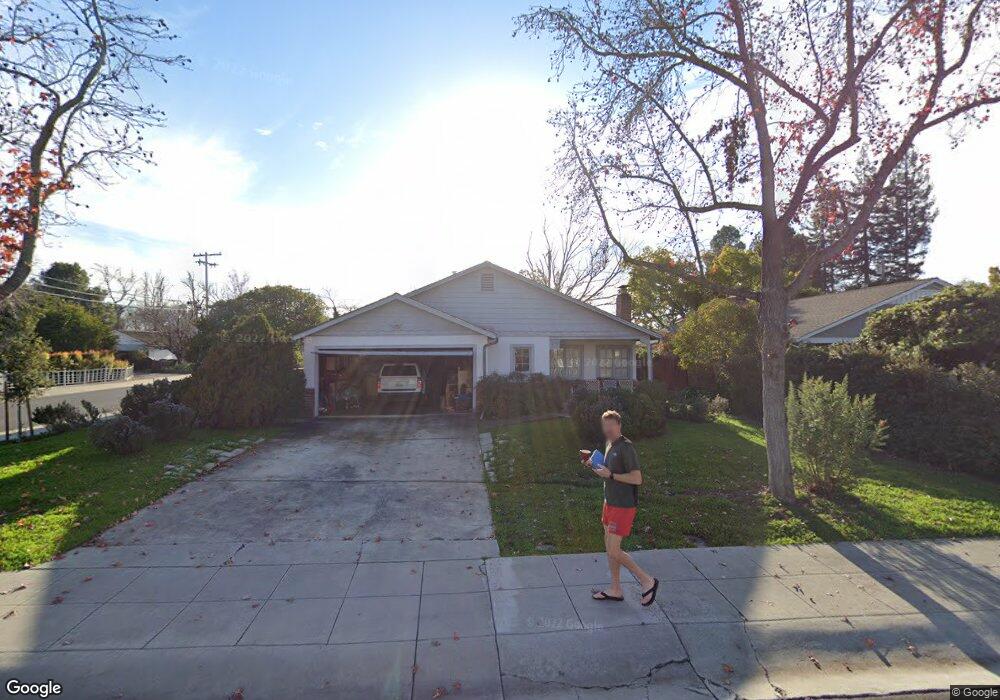
2798 South Ct Palo Alto, CA 94306
Midtown Palo Alto NeighborhoodEstimated Value: $2,810,000 - $3,440,000
3
Beds
2
Baths
1,391
Sq Ft
$2,223/Sq Ft
Est. Value
About This Home
This home is located at 2798 South Ct, Palo Alto, CA 94306 and is currently estimated at $3,091,664, approximately $2,222 per square foot. 2798 South Ct is a home located in Santa Clara County with nearby schools including El Carmelo Elementary School, Jane Lathrop Stanford Middle School, and Palo Alto High School.
Ownership History
Date
Name
Owned For
Owner Type
Purchase Details
Closed on
Aug 30, 2022
Sold by
Michael Joseph
Bought by
Michael Joseph Trust
Current Estimated Value
Home Financials for this Owner
Home Financials are based on the most recent Mortgage that was taken out on this home.
Original Mortgage
$4,249,728
Outstanding Balance
$4,232,802
Interest Rate
5.22%
Mortgage Type
Credit Line Revolving
Estimated Equity
-$1,141,138
Purchase Details
Closed on
Oct 25, 1996
Sold by
Irving Joseph
Bought by
Joseph Marcia
Create a Home Valuation Report for This Property
The Home Valuation Report is an in-depth analysis detailing your home's value as well as a comparison with similar homes in the area
Home Values in the Area
Average Home Value in this Area
Purchase History
| Date | Buyer | Sale Price | Title Company |
|---|---|---|---|
| Michael Joseph Trust | -- | -- | |
| Joseph Marcia | -- | -- |
Source: Public Records
Mortgage History
| Date | Status | Borrower | Loan Amount |
|---|---|---|---|
| Open | Michael Joseph Trust | $4,249,728 |
Source: Public Records
Tax History Compared to Growth
Tax History
| Year | Tax Paid | Tax Assessment Tax Assessment Total Assessment is a certain percentage of the fair market value that is determined by local assessors to be the total taxable value of land and additions on the property. | Land | Improvement |
|---|---|---|---|---|
| 2025 | $16,478 | $1,349,894 | $1,267,369 | $82,525 |
| 2024 | $16,478 | $1,323,426 | $1,242,519 | $80,907 |
| 2023 | $16,232 | $1,297,477 | $1,218,156 | $79,321 |
| 2022 | $2,086 | $100,089 | $39,159 | $60,930 |
| 2021 | $2,043 | $98,128 | $38,392 | $59,736 |
| 2020 | $2,017 | $97,123 | $37,999 | $59,124 |
| 2019 | $1,988 | $95,219 | $37,254 | $57,965 |
| 2018 | $1,952 | $93,353 | $36,524 | $56,829 |
| 2017 | $1,915 | $91,523 | $35,808 | $55,715 |
| 2016 | $1,858 | $89,729 | $35,106 | $54,623 |
| 2015 | $1,831 | $88,382 | $34,579 | $53,803 |
| 2014 | $1,695 | $86,652 | $33,902 | $52,750 |
Source: Public Records
Map
Nearby Homes
- 2685 Cowper St
- 151 Colorado Ave
- 2760 Byron St
- 2590 Webster St
- 200 Sheridan Ave Unit 303
- 200 Sheridan Ave Unit 304
- 200 Sheridan Ave Unit 103
- 200 Sheridan Ave Unit 307
- 360 Fernando Ave
- 3213 Alma St
- 3 Plan at Acacia
- 2A Plan at Acacia
- 1 Plan at Acacia
- 5 Plan at Acacia
- 4X Plan at Acacia
- 2 Plan at Acacia
- 4 Plan at Acacia
- 339 El Verano Ave
- 777 Moreno Ave
- 410 Sheridan Ave Unit 446