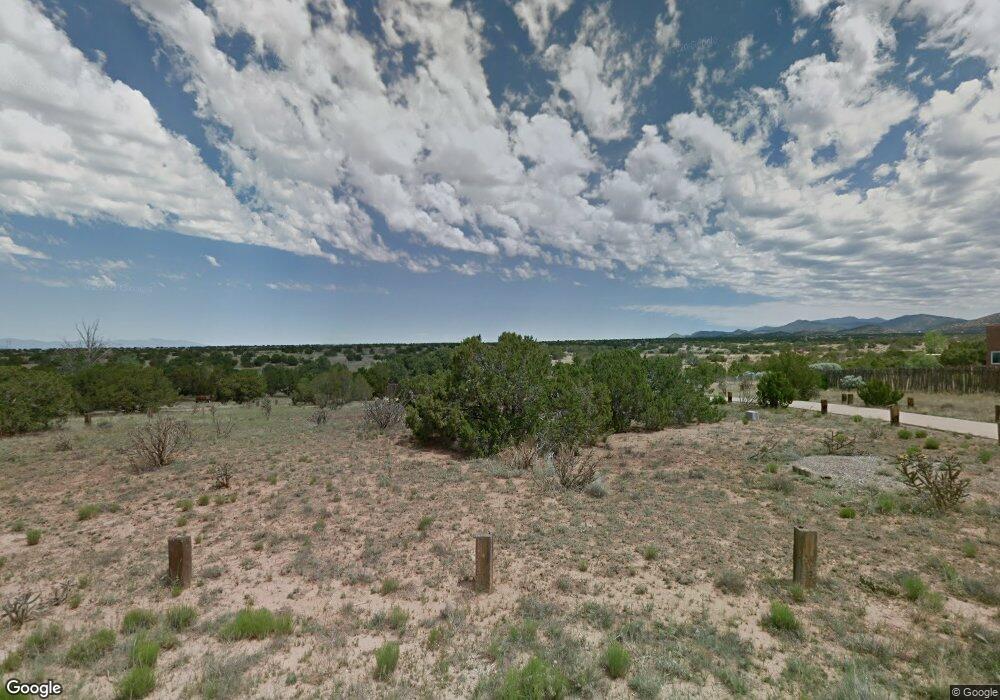
28 Alcalde Rd Santa Fe, NM 87508
Eldorado at Santa Fe NeighborhoodEstimated Value: $539,000 - $606,510
2
Beds
2
Baths
1,513
Sq Ft
$372/Sq Ft
Est. Value
About This Home
This home is located at 28 Alcalde Rd, Santa Fe, NM 87508 and is currently estimated at $562,378, approximately $371 per square foot. 28 Alcalde Rd is a home located in Santa Fe County with nearby schools including El Dorado Community School and Santa Fe High School.
Ownership History
Date
Name
Owned For
Owner Type
Purchase Details
Closed on
Dec 2, 2020
Sold by
Beyer Theresa A
Bought by
Dicello Michael L and Dicello Kelly R
Current Estimated Value
Home Financials for this Owner
Home Financials are based on the most recent Mortgage that was taken out on this home.
Original Mortgage
$355,914
Outstanding Balance
$317,435
Interest Rate
2.8%
Mortgage Type
VA
Estimated Equity
$244,943
Purchase Details
Closed on
Jul 10, 2019
Sold by
Cox John D
Bought by
Beyer Theresa A
Home Financials for this Owner
Home Financials are based on the most recent Mortgage that was taken out on this home.
Original Mortgage
$241,000
Interest Rate
3.9%
Mortgage Type
New Conventional
Purchase Details
Closed on
Mar 13, 2012
Sold by
Mcmillna Amy and Little Karen
Bought by
Cox John D
Home Financials for this Owner
Home Financials are based on the most recent Mortgage that was taken out on this home.
Original Mortgage
$180,000
Interest Rate
3.91%
Mortgage Type
New Conventional
Create a Home Valuation Report for This Property
The Home Valuation Report is an in-depth analysis detailing your home's value as well as a comparison with similar homes in the area
Home Values in the Area
Average Home Value in this Area
Purchase History
| Date | Buyer | Sale Price | Title Company |
|---|---|---|---|
| Dicello Michael L | -- | Artisan Title | |
| Beyer Theresa A | -- | Prima Title Llc | |
| Cox John D | -- | Prima Title Llc |
Source: Public Records
Mortgage History
| Date | Status | Borrower | Loan Amount |
|---|---|---|---|
| Open | Dicello Michael L | $355,914 | |
| Previous Owner | Beyer Theresa A | $241,000 | |
| Previous Owner | Cox John D | $180,000 |
Source: Public Records
Tax History Compared to Growth
Tax History
| Year | Tax Paid | Tax Assessment Tax Assessment Total Assessment is a certain percentage of the fair market value that is determined by local assessors to be the total taxable value of land and additions on the property. | Land | Improvement |
|---|---|---|---|---|
| 2024 | $3,015 | $449,097 | $80,424 | $368,673 |
| 2023 | $3,145 | $436,017 | $78,082 | $357,935 |
| 2022 | $3,065 | $423,318 | $75,808 | $347,510 |
| 2021 | $3,006 | $136,996 | $24,533 | $112,463 |
| 2020 | $2,634 | $119,215 | $22,866 | $96,349 |
| 2019 | $1,658 | $74,289 | $22,866 | $51,423 |
| 2018 | $1,614 | $72,126 | $22,371 | $49,755 |
| 2017 | $1,559 | $70,025 | $21,720 | $48,305 |
| 2016 | $1,464 | $67,986 | $21,088 | $46,898 |
| 2015 | $1,435 | $66,007 | $21,087 | $44,920 |
| 2014 | $1,426 | $67,179 | $21,066 | $46,114 |
Source: Public Records
Map
Nearby Homes