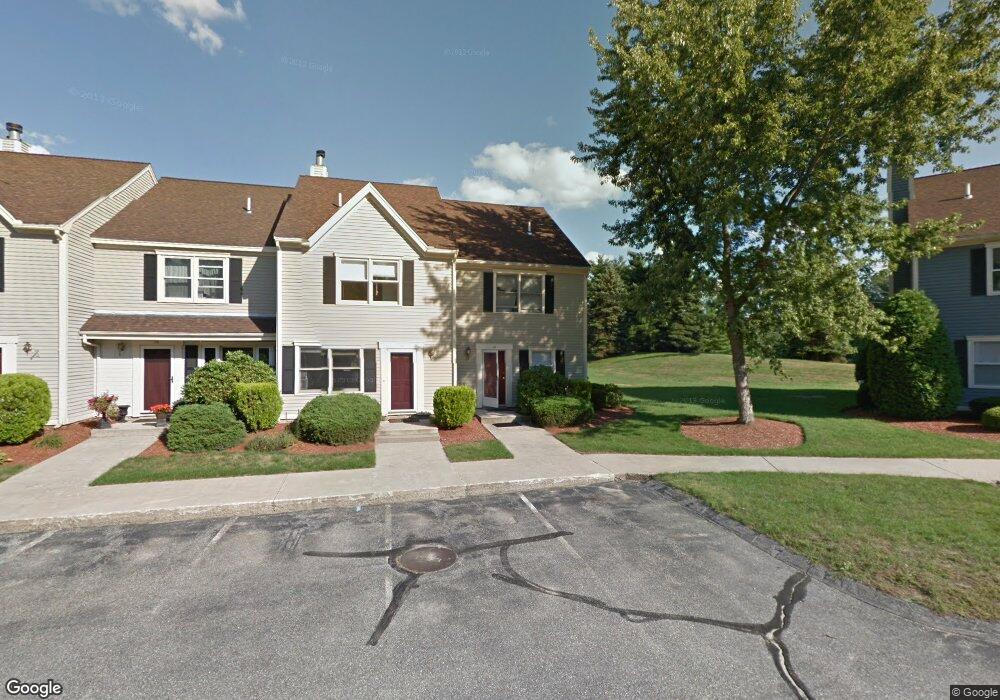
28 Cadogan Way Unit UY255 Nashua, NH 03062
Southwest Nashua NeighborhoodEstimated Value: $391,000 - $421,000
3
Beds
3
Baths
1,566
Sq Ft
$257/Sq Ft
Est. Value
About This Home
This home is located at 28 Cadogan Way Unit UY255, Nashua, NH 03062 and is currently estimated at $401,912, approximately $256 per square foot. 28 Cadogan Way Unit UY255 is a home located in Hillsborough County with nearby schools including Bicentennial Elementary School, Fairgrounds Middle School, and Nashua High School South.
Ownership History
Date
Name
Owned For
Owner Type
Purchase Details
Closed on
Dec 12, 2018
Sold by
Senthilnathan Janakiraman and Senthilnathan Anita
Bought by
Sai Dham Apartment Homes
Current Estimated Value
Purchase Details
Closed on
Nov 20, 2017
Sold by
Senthilnathan Janakiraman and Senthilnathan Anita
Bought by
Cadogan Way Rental Llc
Purchase Details
Closed on
Jun 28, 2002
Sold by
Kloo Gregory J
Bought by
Senthilnathan Janakiraman and Senthilnathan Anita
Home Financials for this Owner
Home Financials are based on the most recent Mortgage that was taken out on this home.
Original Mortgage
$129,600
Interest Rate
6.92%
Purchase Details
Closed on
Nov 30, 1998
Sold by
Goodman Roy E and Goodman Laurie G
Bought by
Kloo Gregory J
Home Financials for this Owner
Home Financials are based on the most recent Mortgage that was taken out on this home.
Original Mortgage
$87,050
Interest Rate
6.83%
Create a Home Valuation Report for This Property
The Home Valuation Report is an in-depth analysis detailing your home's value as well as a comparison with similar homes in the area
Home Values in the Area
Average Home Value in this Area
Purchase History
| Date | Buyer | Sale Price | Title Company |
|---|---|---|---|
| Sai Dham Apartment Homes | -- | -- | |
| Senthilnathan Janakiraman | -- | -- | |
| Cadogan Way Rental Llc | -- | -- | |
| Senthilnathan Janakiraman | $164,900 | -- | |
| Kloo Gregory J | $89,500 | -- |
Source: Public Records
Mortgage History
| Date | Status | Borrower | Loan Amount |
|---|---|---|---|
| Previous Owner | Kloo Gregory J | $129,600 | |
| Previous Owner | Kloo Gregory J | $87,050 |
Source: Public Records
Tax History Compared to Growth
Tax History
| Year | Tax Paid | Tax Assessment Tax Assessment Total Assessment is a certain percentage of the fair market value that is determined by local assessors to be the total taxable value of land and additions on the property. | Land | Improvement |
|---|---|---|---|---|
| 2024 | $5,325 | $334,900 | $0 | $334,900 |
| 2023 | $5,137 | $281,800 | $0 | $281,800 |
| 2022 | $5,092 | $281,800 | $0 | $281,800 |
| 2021 | $4,574 | $197,000 | $0 | $197,000 |
| 2020 | $4,454 | $197,000 | $0 | $197,000 |
| 2019 | $4,287 | $197,000 | $0 | $197,000 |
| 2018 | $4,178 | $197,000 | $0 | $197,000 |
| 2017 | $4,232 | $164,100 | $0 | $164,100 |
| 2016 | $4,114 | $164,100 | $0 | $164,100 |
| 2015 | $4,025 | $164,100 | $0 | $164,100 |
| 2014 | $3,947 | $164,100 | $0 | $164,100 |
Source: Public Records
Map
Nearby Homes
- 32 Cadogan Way Unit UZ257
- 51 Legacy Dr
- 8 Hikers Ln
- 4 Hikers Ln
- 7 Doucet Ave
- 65 Wilderness Dr
- 19 Georgetown Dr
- 58 Wilderness Dr
- 50 Wilderness Dr
- 4 Wilderness Dr
- 1 Wilderness Dr
- 57 Wilderness Dr
- 59 Wilderness Dr
- 79 Wilderness Dr
- 6 Wilderness Dr
- 3 Wilderness Dr
- 61 Wilderness Dr
- 2 Wilderness Dr
- 7 Wilderness Dr
- 63 Wilderness Dr Unit Derby 2
- 26 Cadogan Way Unit UY254
- 22 Cadogan Way Unit UY252
- 30 Cadogan Way Unit UZ256
- 30 Cadogan Way Unit 30
- 30 Cadogan Way
- 20 Cadogan Way Unit UY251
- 20 Cadogan Way Unit 20
- 20 Cadogan Way Unit Y-251
- 34 Cadogan Way Unit UZ258
- 10 Cadogan Way Unit UU234
- 10 Cadogan Way Unit V234
- 12 Cadogan Way Unit UV235
- 14 Cadogan Way Unit UV236
- 36 Cadogan Way Unit UZ259
- 36 Cadogan Way Unit Z259
- 38 Cadogan Way Unit UZ260
- 40 Cadogan Way Unit UZ261
- 24 Cadogan Way Unit UY253
- 42 Cadogan Way Unit UAA262
- 44 Cadogan Way Unit UAA263