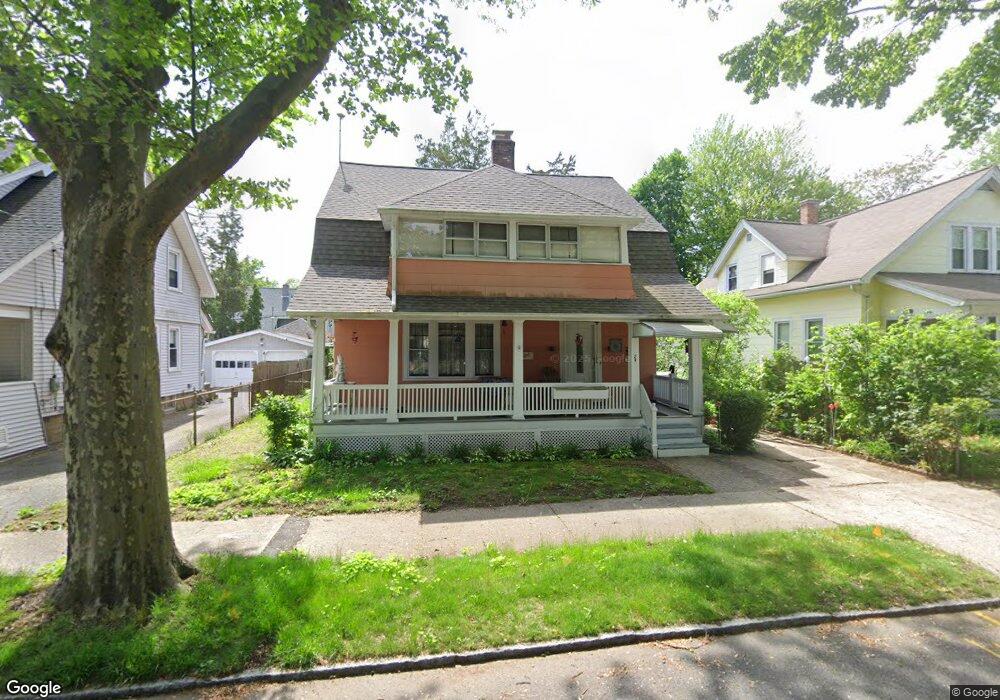
28 Castle St Springfield, MA 01118
East Forest Park NeighborhoodEstimated Value: $280,169 - $314,000
4
Beds
2
Baths
1,456
Sq Ft
$200/Sq Ft
Est. Value
About This Home
This home is located at 28 Castle St, Springfield, MA 01118 and is currently estimated at $291,292, approximately $200 per square foot. 28 Castle St is a home located in Hampden County with nearby schools including Frederick Harris Elementary School, M Marcus Kiley Middle, and High School Of Commerce.
Ownership History
Date
Name
Owned For
Owner Type
Purchase Details
Closed on
Jun 15, 1989
Sold by
Gilday Santina H
Bought by
Bueno Otilia
Current Estimated Value
Home Financials for this Owner
Home Financials are based on the most recent Mortgage that was taken out on this home.
Original Mortgage
$109,000
Interest Rate
10.87%
Mortgage Type
Purchase Money Mortgage
Create a Home Valuation Report for This Property
The Home Valuation Report is an in-depth analysis detailing your home's value as well as a comparison with similar homes in the area
Home Values in the Area
Average Home Value in this Area
Purchase History
| Date | Buyer | Sale Price | Title Company |
|---|---|---|---|
| Bueno Otilia | $115,000 | -- |
Source: Public Records
Mortgage History
| Date | Status | Borrower | Loan Amount |
|---|---|---|---|
| Closed | Bueno Otilia | $109,000 |
Source: Public Records
Tax History
| Year | Tax Paid | Tax Assessment Tax Assessment Total Assessment is a certain percentage of the fair market value that is determined by local assessors to be the total taxable value of land and additions on the property. | Land | Improvement |
|---|---|---|---|---|
| 2025 | $3,577 | $228,100 | $36,800 | $191,300 |
| 2024 | $3,642 | $226,800 | $36,800 | $190,000 |
| 2023 | $3,279 | $192,300 | $35,100 | $157,200 |
| 2022 | $3,275 | $174,000 | $35,100 | $138,900 |
| 2021 | $3,130 | $165,600 | $31,900 | $133,700 |
| 2020 | $2,738 | $140,200 | $31,900 | $108,300 |
| 2019 | $2,787 | $141,600 | $31,900 | $109,700 |
| 2018 | $2,732 | $138,800 | $31,900 | $106,900 |
| 2017 | $2,461 | $125,200 | $30,500 | $94,700 |
| 2016 | $2,367 | $120,400 | $30,500 | $89,900 |
| 2015 | $2,292 | $116,500 | $30,500 | $86,000 |
Source: Public Records
Map
Nearby Homes
- 13 Bither St
- 1088 Sumner Ave
- 77 Dorset St
- 67 Perkins St
- 161 Dorset St
- 46 Eckington St
- 854-856 Sumner Ave
- 134 Eddywood St
- 79 Roosevelt Ave
- 88 Brunswick St
- 59 Daviston St
- 79 Arvilla St
- 47 Hartford Terrace
- 170 Plumtree Rd
- 914-916 Belmont Ave
- 55 Mandalay Rd
- 410 Allen St
- 22 Eleanor Rd
- 7 Ashbrook St
- 33-35 Ruskin St
Your Personal Tour Guide
Ask me questions while you tour the home.