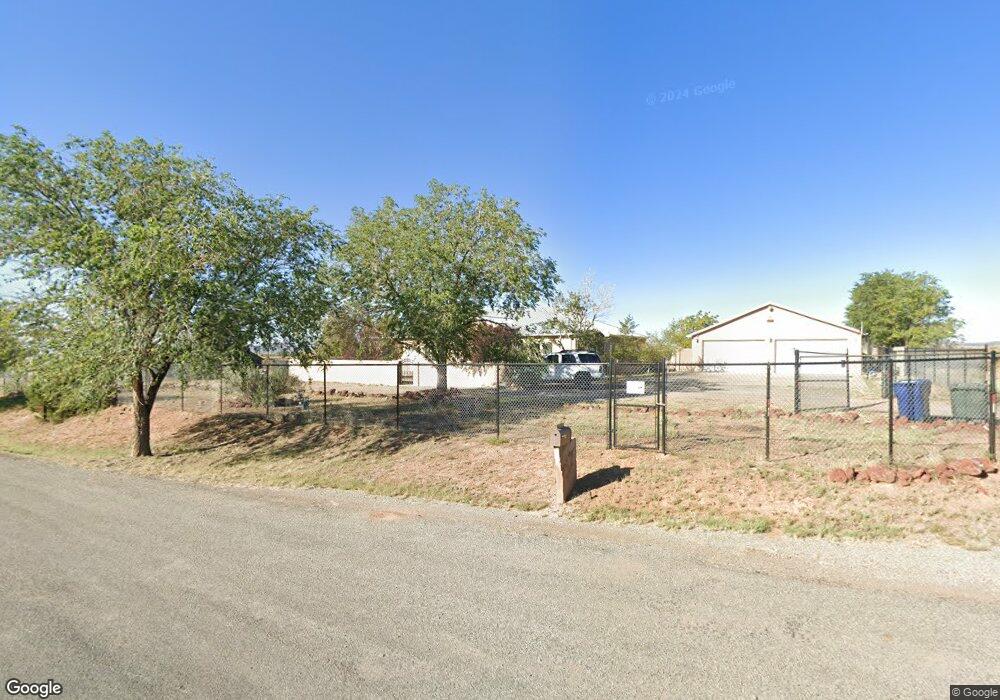
28 Chalan Rd Santa Fe, NM 87507
Southwest Santa Fe NeighborhoodEstimated Value: $668,000 - $842,000
4
Beds
3
Baths
3,166
Sq Ft
$241/Sq Ft
Est. Value
About This Home
This home is located at 28 Chalan Rd, Santa Fe, NM 87507 and is currently estimated at $761,996, approximately $240 per square foot. 28 Chalan Rd is a home located in Santa Fe County with nearby schools including Pinon Elementary School, Milagro Middle School, and Capital High School.
Ownership History
Date
Name
Owned For
Owner Type
Purchase Details
Closed on
Aug 25, 2017
Sold by
Martinez Lita and Herrera Lit
Bought by
Herrera Lloyd R
Current Estimated Value
Home Financials for this Owner
Home Financials are based on the most recent Mortgage that was taken out on this home.
Original Mortgage
$345,000
Outstanding Balance
$288,254
Interest Rate
3.92%
Mortgage Type
New Conventional
Estimated Equity
$473,742
Purchase Details
Closed on
Jun 21, 2001
Sold by
Herrera Lloyd R and Herrera Lita
Bought by
Herrera Lloyd R and Herrera Lita
Home Financials for this Owner
Home Financials are based on the most recent Mortgage that was taken out on this home.
Original Mortgage
$101,650
Interest Rate
7.11%
Purchase Details
Closed on
Dec 10, 1999
Sold by
Lujan Jose P G and Lujan Gema C
Bought by
Herrera Lloyd R and Martinez Lita
Home Financials for this Owner
Home Financials are based on the most recent Mortgage that was taken out on this home.
Original Mortgage
$98,000
Interest Rate
7.86%
Create a Home Valuation Report for This Property
The Home Valuation Report is an in-depth analysis detailing your home's value as well as a comparison with similar homes in the area
Home Values in the Area
Average Home Value in this Area
Purchase History
| Date | Buyer | Sale Price | Title Company |
|---|---|---|---|
| Herrera Lloyd R | -- | First American Title Inc | |
| Herrera Lloyd R | -- | Titles De Santa Fe Inc | |
| Herrera Lloyd R | -- | Territorial Abstract & Title |
Source: Public Records
Mortgage History
| Date | Status | Borrower | Loan Amount |
|---|---|---|---|
| Open | Herrera Lloyd R | $345,000 | |
| Closed | Herrera Lloyd R | $101,650 | |
| Closed | Herrera Lloyd R | $98,000 |
Source: Public Records
Tax History
| Year | Tax Paid | Tax Assessment Tax Assessment Total Assessment is a certain percentage of the fair market value that is determined by local assessors to be the total taxable value of land and additions on the property. | Land | Improvement |
|---|---|---|---|---|
| 2025 | $2,993 | $400,321 | $104,354 | $295,967 |
| 2024 | $2,916 | $388,662 | $101,315 | $287,347 |
| 2023 | $2,915 | $377,343 | $98,365 | $278,978 |
| 2022 | $2,849 | $366,353 | $95,500 | $270,853 |
| 2021 | $2,803 | $118,561 | $33,873 | $84,688 |
| 2020 | $2,718 | $115,109 | $32,887 | $82,222 |
| 2019 | $2,679 | $111,756 | $31,929 | $79,827 |
| 2018 | $2,618 | $108,501 | $30,999 | $77,502 |
| 2017 | $2,629 | $108,501 | $30,999 | $77,502 |
| 2016 | $2,553 | $108,501 | $31,000 | $77,501 |
| 2015 | $2,523 | $106,623 | $31,000 | $75,623 |
| 2014 | $2,528 | $110,113 | $30,969 | $79,144 |
Source: Public Records
Map
Nearby Homes
- 27 Firecrown Ln
- 32 Wirecrest Ln
- 74 Mountaingem Loop
- 92 Mountaingem Loop
- 21 Goldentail Ln
- 19 Canyon Cliff Dr
- 32 Sunset Canyon Ln
- 4748 Vista Del Sol
- 6751 Camino Carlita
- 7223 Via Verde
- 6939 Golden Mesa
- 4725 Sundial Way
- 4650 Camino Cuervo
- 7000 Camino Rojo
- 4644 Callejon Lechuza
- 7609 Arroyo Oeste
- 4615 Sunset Ridge
- 4609 Contenta Ridge
- 4715 Sambra Dr
- 6985 Golden Mesa
- 29 Calle Prado
- 29 Chalan Rd
- 30 Calle Prado
- 27 Calle Prado
- 21 Chalan Rd
- 28 Calle Prado
- 22 Chalan Rd
- 23 Calle Prado
- 19 Chalan Rd
- 20 Cottontail Rd
- 20 Cottontail Rd Unit A
- 20 Calle Prado
- 16 Chalan Rd
- 15 Chalan Rd
- 8 Chaparral Dr
- 8 Chaparral Dr Unit A
- 15 Cottontail Rd
- 15 Cottontail Rd Unit A
- 1 S Chaparral
- 16 Cottontail Rd
Your Personal Tour Guide
Ask me questions while you tour the home.