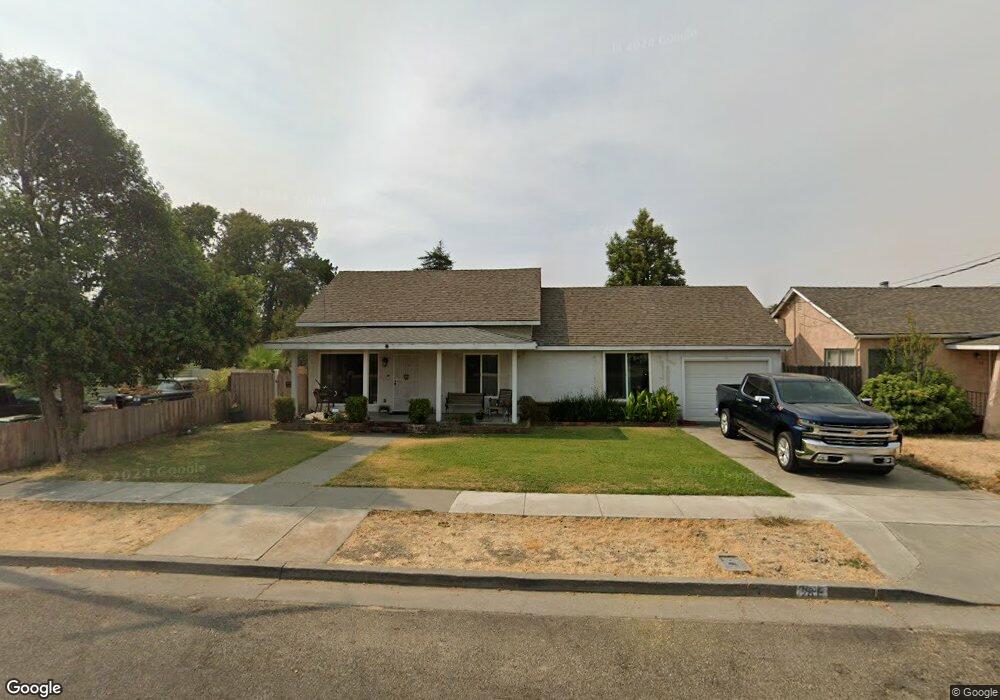
28 E Mill St Orland, CA 95963
Estimated Value: $339,010 - $408,000
3
Beds
2
Baths
1,753
Sq Ft
$210/Sq Ft
Est. Value
About This Home
This home is located at 28 E Mill St, Orland, CA 95963 and is currently estimated at $367,503, approximately $209 per square foot. 28 E Mill St is a home located in Glenn County with nearby schools including Mill Street Elementary School, Fairview Elementary School, and Price Intermediate School.
Ownership History
Date
Name
Owned For
Owner Type
Purchase Details
Closed on
Jun 1, 2018
Sold by
Stone Frank H and Stone Kimberly A
Bought by
Stone Frank H and Stone Kimberly A
Current Estimated Value
Home Financials for this Owner
Home Financials are based on the most recent Mortgage that was taken out on this home.
Original Mortgage
$238,009
Outstanding Balance
$204,092
Interest Rate
4.5%
Mortgage Type
VA
Estimated Equity
$163,411
Purchase Details
Closed on
Nov 8, 2010
Sold by
Wortham Shirley J and Montgomery Rowanda S
Bought by
Stone Frank H
Home Financials for this Owner
Home Financials are based on the most recent Mortgage that was taken out on this home.
Original Mortgage
$92,434
Interest Rate
4.17%
Mortgage Type
FHA
Purchase Details
Closed on
Sep 18, 2007
Sold by
Ballew Linda A
Bought by
Ballew Thomas A
Create a Home Valuation Report for This Property
The Home Valuation Report is an in-depth analysis detailing your home's value as well as a comparison with similar homes in the area
Purchase History
| Date | Buyer | Sale Price | Title Company |
|---|---|---|---|
| Stone Frank H | -- | Title Connect Inc | |
| Stone Frank H | $149,000 | North State Title Company | |
| Ballew Thomas A | -- | Glenn County Title Company | |
| Ballew Paul J | -- | Glenn County Title Company | |
| Montgomery Rowanda S | -- | Glenn County Title Company | |
| Wortham Shirley J | -- | Glenn County Title Company |
Source: Public Records
Mortgage History
| Date | Status | Borrower | Loan Amount |
|---|---|---|---|
| Open | Stone Frank H | $238,009 | |
| Closed | Stone Frank H | $92,434 |
Source: Public Records
Tax History
| Year | Tax Paid | Tax Assessment Tax Assessment Total Assessment is a certain percentage of the fair market value that is determined by local assessors to be the total taxable value of land and additions on the property. | Land | Improvement |
|---|---|---|---|---|
| 2025 | $1,957 | $184,477 | $38,430 | $146,047 |
| 2024 | $1,957 | $180,861 | $37,677 | $143,184 |
| 2023 | $1,912 | $177,316 | $36,939 | $140,377 |
| 2022 | $1,876 | $173,840 | $36,215 | $137,625 |
| 2021 | $1,862 | $170,432 | $35,505 | $134,927 |
| 2020 | $1,860 | $168,685 | $35,141 | $133,544 |
| 2019 | $1,845 | $165,378 | $34,452 | $130,926 |
| 2018 | $1,798 | $162,136 | $33,777 | $128,359 |
| 2017 | $1,866 | $158,958 | $33,115 | $125,843 |
| 2016 | $1,753 | $155,842 | $32,466 | $123,376 |
| 2015 | $1,727 | $153,502 | $31,979 | $121,523 |
| 2014 | $1,694 | $150,496 | $31,353 | $119,143 |
Source: Public Records
Map
Nearby Homes
Your Personal Tour Guide
Ask me questions while you tour the home.