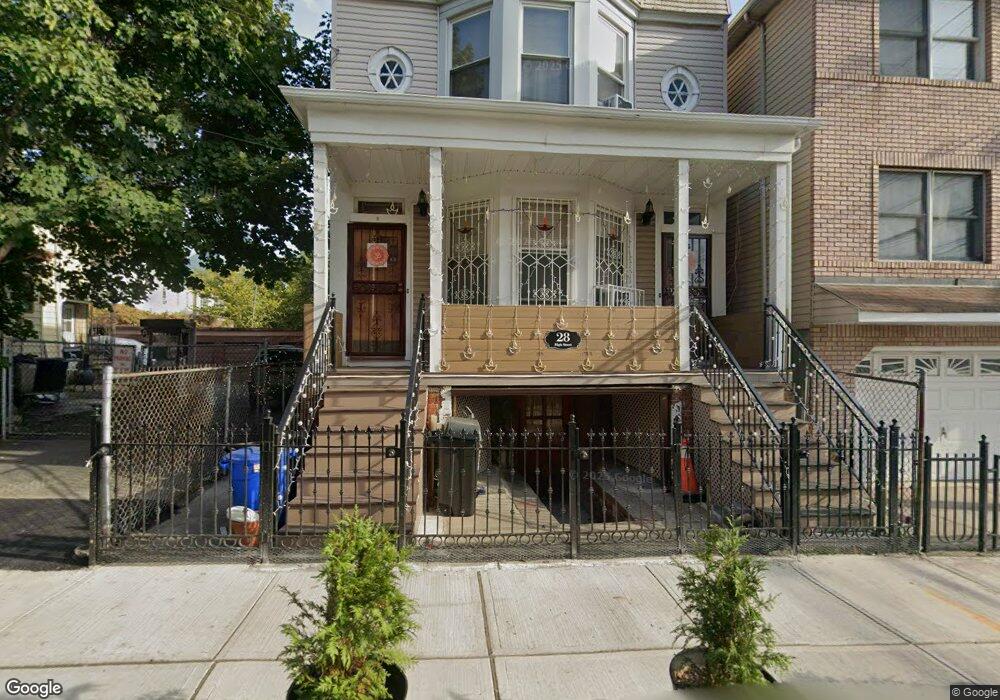
28 High St Unit 2 Jersey City, NJ 07306
Journal Square NeighborhoodEstimated Value: $865,000 - $1,320,605
--
Bed
--
Bath
2,310
Sq Ft
$465/Sq Ft
Est. Value
About This Home
This home is located at 28 High St Unit 2, Jersey City, NJ 07306 and is currently estimated at $1,073,901, approximately $464 per square foot. 28 High St Unit 2 is a home located in Hudson County with nearby schools including Martin Luther King Jr. School - P.S. 11, William L. Dickinson High School, and Liberty High School.
Ownership History
Date
Name
Owned For
Owner Type
Purchase Details
Closed on
Jul 21, 2000
Sold by
Tolani Arjan and Tolani Malti
Bought by
Puri Nihal
Current Estimated Value
Home Financials for this Owner
Home Financials are based on the most recent Mortgage that was taken out on this home.
Original Mortgage
$158,650
Outstanding Balance
$56,368
Interest Rate
8.13%
Mortgage Type
Purchase Money Mortgage
Estimated Equity
$1,017,533
Purchase Details
Closed on
Apr 24, 2000
Sold by
Ventrone Caren and Ventrone Michael
Bought by
Bayview Financial Acquisition Trust
Home Financials for this Owner
Home Financials are based on the most recent Mortgage that was taken out on this home.
Original Mortgage
$158,650
Interest Rate
8.13%
Mortgage Type
Purchase Money Mortgage
Create a Home Valuation Report for This Property
The Home Valuation Report is an in-depth analysis detailing your home's value as well as a comparison with similar homes in the area
Home Values in the Area
Average Home Value in this Area
Purchase History
| Date | Buyer | Sale Price | Title Company |
|---|---|---|---|
| Puri Nihal | $167,000 | First American Title Ins Co | |
| Bayview Financial Acquisition Trust | $85,700 | -- |
Source: Public Records
Mortgage History
| Date | Status | Borrower | Loan Amount |
|---|---|---|---|
| Open | Puri Nihal | $158,650 | |
| Previous Owner | Bayview Financial Acquisition Trust | $158,650 |
Source: Public Records
Tax History Compared to Growth
Tax History
| Year | Tax Paid | Tax Assessment Tax Assessment Total Assessment is a certain percentage of the fair market value that is determined by local assessors to be the total taxable value of land and additions on the property. | Land | Improvement |
|---|---|---|---|---|
| 2025 | $12,701 | $568,800 | $303,000 | $265,800 |
| 2024 | $12,781 | $568,800 | $303,000 | $265,800 |
| 2023 | $12,781 | $568,800 | $303,000 | $265,800 |
| 2022 | $12,047 | $568,800 | $303,000 | $265,800 |
| 2021 | $9,124 | $568,800 | $303,000 | $265,800 |
| 2020 | $9,158 | $568,800 | $303,000 | $265,800 |
| 2019 | $8,760 | $568,800 | $303,000 | $265,800 |
| 2018 | $1,771 | $568,800 | $303,000 | $265,800 |
| 2017 | $9,282 | $119,000 | $15,000 | $104,000 |
| 2016 | $9,164 | $119,000 | $15,000 | $104,000 |
| 2015 | $8,904 | $119,000 | $15,000 | $104,000 |
| 2014 | $8,846 | $119,000 | $15,000 | $104,000 |
Source: Public Records
Map
Nearby Homes
- 24 Perrine Ave
- 22 Perrine Ave Unit 2
- 72 Henry St Unit 10B
- 62 Henry St
- 374 Summit Ave
- 372 Summit Ave
- 549 Pavonia Ave Unit 1 & 2
- 549 Pavonia Ave
- 551 Pavonia Ave Unit 1 &2
- 614-616 Summit Ave
- 126 Chestnut Ave
- 18 Elizabeth St
- 54 Magnolia Ave Unit 1-5
- 191 Academy St
- 492 Pavonia Ave Unit 3
- 47 van Reipen Ave
- 447 Pavonia Ave Unit 3R
- 108 Waldo Ave Unit 1D
- 10 Smith St
- 65 van Reipen Ave
- 26 High St Unit 2
- 32 High St
- 193 Baldwin Ave
- 34 High St
- 8 Perrine Ave Unit 2
- 8 Perrine Ave
- 183 Baldwin Ave
- 12 Perrine Ave
- 10 Perrine Ave Unit 1
- 10 Perrine Ave Unit 3
- 181 Baldwin Ave Unit 3R
- 181 Baldwin Ave Unit 2R
- 181 Baldwin Ave
- 29 High St
- 201 Baldwin Ave
- 201 Baldwin Ave Unit 2
- 14 Perrine Ave
- 14 Perrine Ave Unit 3
- 14 Perrine Ave Unit 1
- 14 Perrine Ave Unit 2