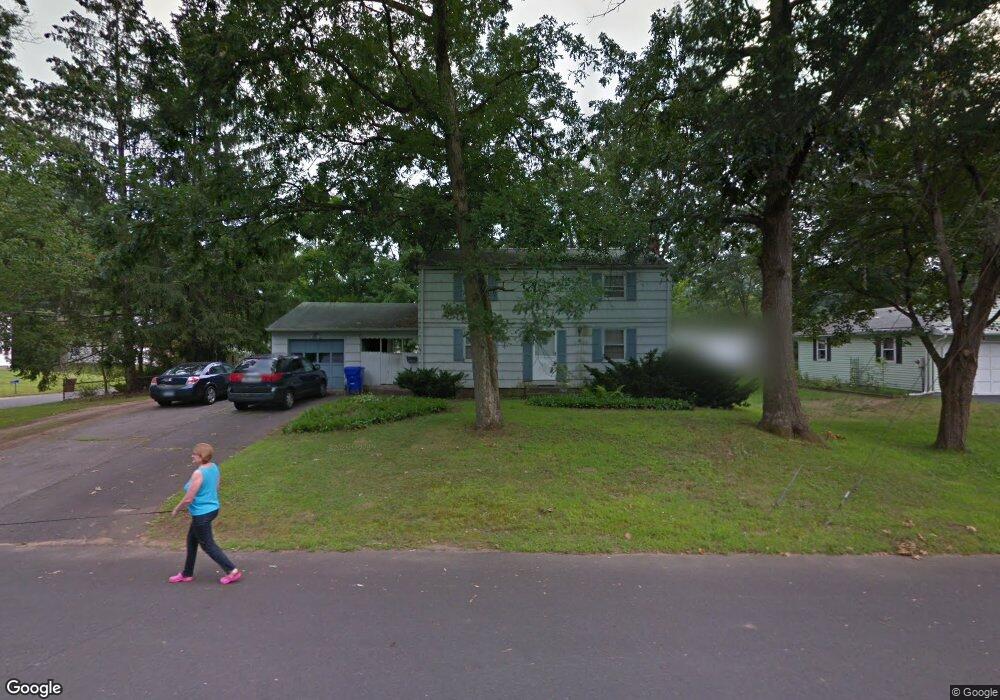
28 Iroquois Rd Enfield, CT 06082
Estimated Value: $335,903 - $369,000
4
Beds
2
Baths
1,632
Sq Ft
$218/Sq Ft
Est. Value
About This Home
This home is located at 28 Iroquois Rd, Enfield, CT 06082 and is currently estimated at $356,476, approximately $218 per square foot. 28 Iroquois Rd is a home located in Hartford County with nearby schools including Edgar H. Parkman School, Enfield Street Elementary School, and John F. Kennedy Middle School.
Ownership History
Date
Name
Owned For
Owner Type
Purchase Details
Closed on
May 25, 2001
Sold by
Est Smith Elouise and Howell Patricia
Bought by
Morrow Jeffrey and Morrow Susan
Current Estimated Value
Home Financials for this Owner
Home Financials are based on the most recent Mortgage that was taken out on this home.
Original Mortgage
$95,000
Outstanding Balance
$35,525
Interest Rate
7.05%
Estimated Equity
$320,951
Create a Home Valuation Report for This Property
The Home Valuation Report is an in-depth analysis detailing your home's value as well as a comparison with similar homes in the area
Home Values in the Area
Average Home Value in this Area
Purchase History
| Date | Buyer | Sale Price | Title Company |
|---|---|---|---|
| Morrow Jeffrey | $145,000 | -- |
Source: Public Records
Mortgage History
| Date | Status | Borrower | Loan Amount |
|---|---|---|---|
| Open | Morrow Jeffrey | $95,000 |
Source: Public Records
Tax History Compared to Growth
Tax History
| Year | Tax Paid | Tax Assessment Tax Assessment Total Assessment is a certain percentage of the fair market value that is determined by local assessors to be the total taxable value of land and additions on the property. | Land | Improvement |
|---|---|---|---|---|
| 2025 | $5,633 | $161,000 | $57,700 | $103,300 |
| 2024 | $5,482 | $161,000 | $57,700 | $103,300 |
| 2023 | $5,442 | $161,000 | $57,700 | $103,300 |
| 2022 | $4,941 | $161,000 | $57,700 | $103,300 |
| 2021 | $4,761 | $126,870 | $47,800 | $79,070 |
| 2020 | $4,761 | $126,870 | $47,800 | $79,070 |
| 2019 | $4,774 | $126,870 | $47,800 | $79,070 |
| 2018 | $4,694 | $126,870 | $47,800 | $79,070 |
| 2017 | $4,432 | $126,870 | $47,800 | $79,070 |
| 2016 | $4,333 | $126,280 | $49,040 | $77,240 |
| 2015 | $4,198 | $126,280 | $49,040 | $77,240 |
| 2014 | $4,089 | $126,280 | $49,040 | $77,240 |
Source: Public Records
Map
Nearby Homes