
Seller's Agent in 2025
Dennisse Rivera
Kempf-Vanderburgh Realty Consultants, Inc.
(860) 313-9964
3 in this area
78 Total Sales
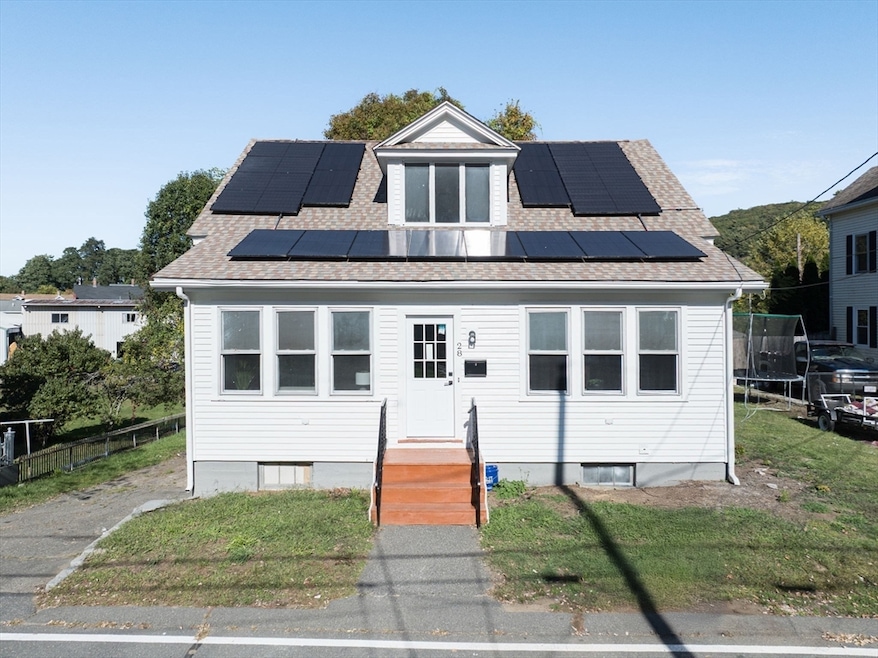


This single-family home presents a unique opportunity to reimagine a classic home. The home has been freshly painted through out. All wood flooring was refinished. The kitchen has new counter tops and new stainless steel appliances. The home includes 4 bedrooms, providing an abundance of space for rest and rejuvenation. Imagine each room becoming a personalized sanctuary, reflecting individual tastes and offering peaceful retreats from the hustle of daily life. The possibilities are endless for creating spaces that nurture creativity and relaxation. The basement offers extra space to create a game room or home theater. The solar panels will help keep cost of utilities low. The one-car garage offers sheltered parking or additional storage. The backyard provides an outdoor canvas for gardening, recreation, or simply enjoying the fresh air. Schedule your personal showing today!
Last Agent to Sell the Property
Kempf-Vanderburgh Realty Consultants, Inc. Listed on: 10/05/2025
| Date | Type | Sale Price | Title Company |
|---|---|---|---|
| Warranty Deed | $280,000 | -- | |
| Warranty Deed | $66,000 | -- | |
| Warranty Deed | $66,000 | -- | |
| Quit Claim Deed | -- | -- | |
| Quit Claim Deed | -- | -- | |
| Quit Claim Deed | -- | -- | |
| Deed | $85,000 | -- | |
| Deed | $85,000 | -- |
| Date | Status | Loan Amount | Loan Type |
|---|---|---|---|
| Open | $273,504 | New Conventional | |
| Previous Owner | $65,000 | Purchase Money Mortgage |
| Date | Event | Price | List to Sale | Price per Sq Ft |
|---|---|---|---|---|
| 11/14/2025 11/14/25 | Sold | $280,000 | -6.6% | $209 / Sq Ft |
| 10/26/2025 10/26/25 | Pending | -- | -- | -- |
| 10/05/2025 10/05/25 | For Sale | $299,900 | -- | $224 / Sq Ft |
| Year | Tax Paid | Tax Assessment Tax Assessment Total Assessment is a certain percentage of the fair market value that is determined by local assessors to be the total taxable value of land and additions on the property. | Land | Improvement |
|---|---|---|---|---|
| 2025 | $3,169 | $210,400 | $26,900 | $183,500 |
| 2024 | $3,019 | $184,900 | $25,400 | $159,500 |
| 2023 | $2,983 | $172,800 | $24,000 | $148,800 |
| 2022 | $2,797 | $144,600 | $22,200 | $122,400 |
| 2021 | $2,682 | $132,900 | $22,200 | $110,700 |
| 2020 | $2,521 | $122,200 | $22,200 | $100,000 |
| 2019 | $2,470 | $122,200 | $22,200 | $100,000 |
| 2018 | $2,407 | $116,200 | $19,400 | $96,800 |
| 2017 | $2,445 | $117,700 | $22,200 | $95,500 |
| 2016 | $2,379 | $117,700 | $22,200 | $95,500 |
| 2015 | $2,313 | $117,700 | $22,200 | $95,500 |
| 2014 | $2,247 | $122,700 | $22,400 | $100,300 |
Seller's Agent in 2025
Dennisse Rivera
Kempf-Vanderburgh Realty Consultants, Inc.
(860) 313-9964
3 in this area
78 Total Sales
Buyer's Agent in 2025
KAREN MILHEM
Media Realty Group Inc.
(774) 321-4541
1 in this area
79 Total Sales
Source: MLS Property Information Network (MLS PIN)
MLS Number: 73439866
APN: WARE-000058-000000-000060
Disclaimer: Certain information contained herein is derived from information provided by parties other than Homes.com. All information provided is deemed reliable, but is not guaranteed to be accurate and should be independently verified.
![]() The property listing data and information, or the Images, set forth herein were provided to MLS Property Information Network, Inc. from third party sources, including sellers, lessors and public records, and were compiled by MLS Property Information Network, Inc. The property listing data and information, and the Images, are for the personal, non-commercial use of consumers having a good faith interest in purchasing or leasing listed properties of the type displayed to them and may not be used for any purpose other than to identify prospective properties which such consumers may have a good faith interest in purchasing or leasing. MLS Property Information Network, Inc. and its subscribers disclaim any and all representations and warranties as to the accuracy of the property listing data and information, or as to the accuracy of any of the Images, set forth herein.
The property listing data and information, or the Images, set forth herein were provided to MLS Property Information Network, Inc. from third party sources, including sellers, lessors and public records, and were compiled by MLS Property Information Network, Inc. The property listing data and information, and the Images, are for the personal, non-commercial use of consumers having a good faith interest in purchasing or leasing listed properties of the type displayed to them and may not be used for any purpose other than to identify prospective properties which such consumers may have a good faith interest in purchasing or leasing. MLS Property Information Network, Inc. and its subscribers disclaim any and all representations and warranties as to the accuracy of the property listing data and information, or as to the accuracy of any of the Images, set forth herein.
Ask me questions while you tour the home.