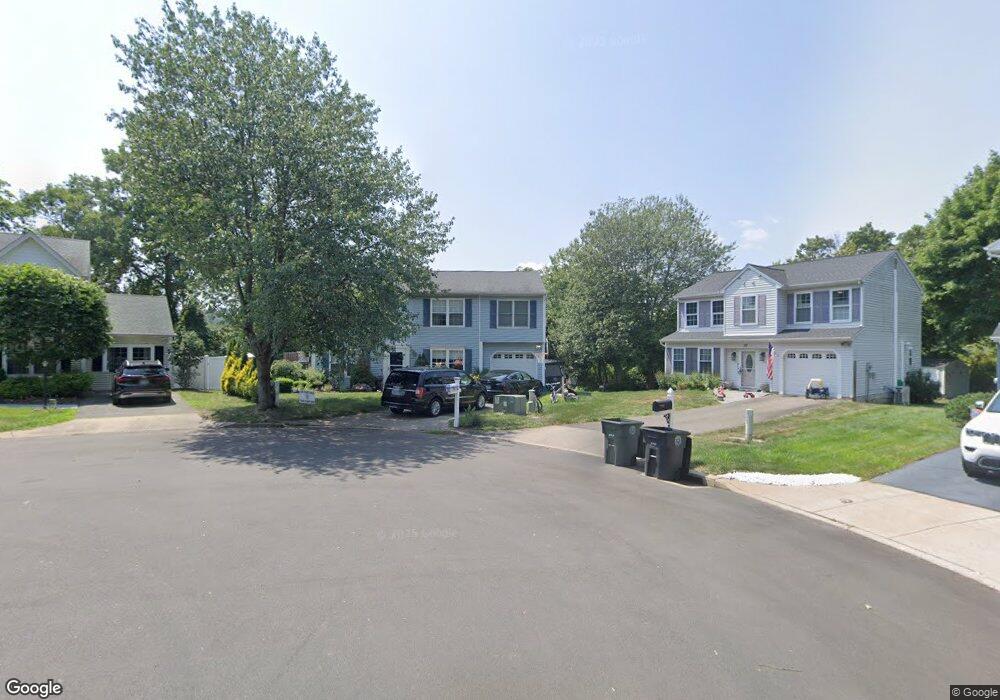
28 Millard Dr Milford, CT 06460
East Milford NeighborhoodEstimated Value: $591,530 - $709,000
4
Beds
3
Baths
1,846
Sq Ft
$348/Sq Ft
Est. Value
About This Home
This home is located at 28 Millard Dr, Milford, CT 06460 and is currently estimated at $643,133, approximately $348 per square foot. 28 Millard Dr is a home located in New Haven County with nearby schools including Live Oaks School, East Shore Middle School, and Joseph A. Foran High School.
Ownership History
Date
Name
Owned For
Owner Type
Purchase Details
Closed on
Oct 20, 2009
Sold by
Robertson Paul and Robertson Jocelyn
Bought by
Vaheb Neema and Vaheb Kathryn
Current Estimated Value
Home Financials for this Owner
Home Financials are based on the most recent Mortgage that was taken out on this home.
Original Mortgage
$276,720
Outstanding Balance
$181,246
Interest Rate
5.14%
Estimated Equity
$461,887
Purchase Details
Closed on
Sep 15, 2004
Sold by
Dellavalle Mark L
Bought by
Robertson Paul and Robertson Jocelyn
Purchase Details
Closed on
Oct 31, 1995
Sold by
Johnson Gary B
Bought by
Dellavalle Mark L
Purchase Details
Closed on
Jul 21, 1994
Sold by
Brennan Barbara D
Bought by
Johnson Gary B
Purchase Details
Closed on
Dec 6, 1993
Sold by
Merwin Est Of Milf Inc
Bought by
Brennan Barbara D
Create a Home Valuation Report for This Property
The Home Valuation Report is an in-depth analysis detailing your home's value as well as a comparison with similar homes in the area
Home Values in the Area
Average Home Value in this Area
Purchase History
| Date | Buyer | Sale Price | Title Company |
|---|---|---|---|
| Vaheb Neema | $345,900 | -- | |
| Vaheb Neema | $345,900 | -- | |
| Robertson Paul | $329,000 | -- | |
| Robertson Paul | $329,000 | -- | |
| Dellavalle Mark L | $165,500 | -- | |
| Dellavalle Mark L | $165,500 | -- | |
| Johnson Gary B | $160,000 | -- | |
| Johnson Gary B | $160,000 | -- | |
| Brennan Barbara D | $155,000 | -- | |
| Brennan Barbara D | $155,000 | -- |
Source: Public Records
Mortgage History
| Date | Status | Borrower | Loan Amount |
|---|---|---|---|
| Open | Brennan Barbara D | $75,600 | |
| Open | Brennan Barbara D | $276,720 |
Source: Public Records
Tax History Compared to Growth
Tax History
| Year | Tax Paid | Tax Assessment Tax Assessment Total Assessment is a certain percentage of the fair market value that is determined by local assessors to be the total taxable value of land and additions on the property. | Land | Improvement |
|---|---|---|---|---|
| 2025 | $7,943 | $268,790 | $110,600 | $158,190 |
| 2024 | $7,833 | $268,790 | $110,600 | $158,190 |
| 2023 | $7,303 | $268,790 | $110,600 | $158,190 |
| 2022 | $7,163 | $268,790 | $110,600 | $158,190 |
| 2021 | $6,059 | $219,140 | $78,860 | $140,280 |
| 2020 | $6,066 | $219,140 | $78,860 | $140,280 |
| 2019 | $6,072 | $219,140 | $78,860 | $140,280 |
| 2018 | $6,079 | $219,140 | $78,860 | $140,280 |
| 2017 | $6,090 | $219,140 | $78,860 | $140,280 |
| 2016 | $6,607 | $237,320 | $91,690 | $145,630 |
| 2015 | $6,321 | $226,730 | $91,690 | $135,040 |
| 2014 | $6,172 | $226,730 | $91,690 | $135,040 |
Source: Public Records
Map
Nearby Homes
- 207 Merwin Ave
- 49 Merwin Ave Unit 49
- 152 Beach Ave
- 29 Meetinghouse Ln
- 10 Sperry St
- 25 Village Rd
- 1120 New Haven Ave Unit 148
- 1080 New Haven Ave Unit 113
- 30 Salem Walk
- 15 Greenwich Way
- 32 Burwell Ave
- 64 Greenwich Way
- 32 Wall St
- 18 Riverdale Rd
- 40 Hawley Ave
- 36 Kenwood Rd
- 26 Riverdale Rd
- 35 Whippoorwill Dr
- 22 Hillside Ave
- 6 Howe St