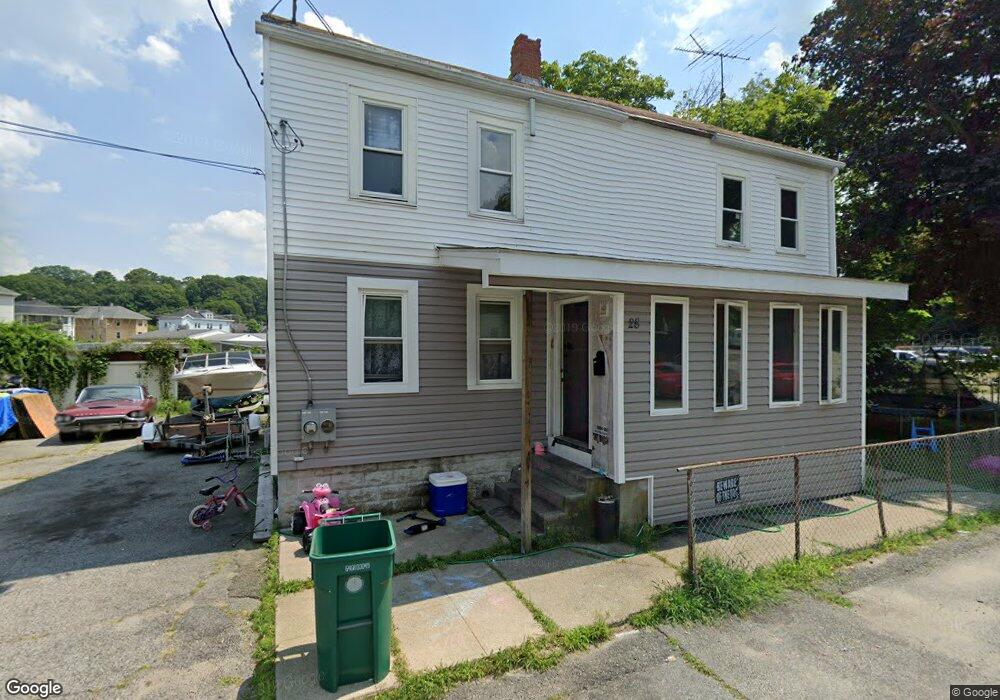
28 New St Woonsocket, RI 02895
Globe District NeighborhoodEstimated Value: $396,151 - $478,000
4
Beds
2
Baths
3,963
Sq Ft
$113/Sq Ft
Est. Value
About This Home
This home is located at 28 New St, Woonsocket, RI 02895 and is currently estimated at $448,038, approximately $113 per square foot. 28 New St is a home located in Providence County with nearby schools including Woonsocket High School and Mount Saint Charles Academy.
Ownership History
Date
Name
Owned For
Owner Type
Purchase Details
Closed on
Sep 14, 2021
Sold by
Woonsocket City Of
Bought by
Airway Leasing Llc
Current Estimated Value
Purchase Details
Closed on
May 22, 2019
Sold by
Woonsocket City Of
Bought by
Roosevelt Assoc Rigp
Purchase Details
Closed on
Jan 20, 2017
Sold by
Woods Robert R and Woonsocket City Of
Bought by
Woods Robert R
Purchase Details
Closed on
Mar 27, 2009
Sold by
Us Bank Na
Bought by
Bubis Edward and Bubis Krystyna
Home Financials for this Owner
Home Financials are based on the most recent Mortgage that was taken out on this home.
Original Mortgage
$312,112
Interest Rate
5.14%
Mortgage Type
Purchase Money Mortgage
Purchase Details
Closed on
Oct 29, 1999
Sold by
Daignault Rose
Bought by
Johnson Robert A
Create a Home Valuation Report for This Property
The Home Valuation Report is an in-depth analysis detailing your home's value as well as a comparison with similar homes in the area
Home Values in the Area
Average Home Value in this Area
Purchase History
| Date | Buyer | Sale Price | Title Company |
|---|---|---|---|
| Airway Leasing Llc | $10,746 | None Available | |
| Airway Leasing Llc | $10,746 | None Available | |
| Airway Leasing Llc | $10,746 | None Available | |
| Roosevelt Assoc Rigp | $10,714 | -- | |
| Roosevelt Assoc Rigp | $10,714 | -- | |
| Woods Robert R | $18,360 | -- | |
| Woods Robert R | $18,360 | -- | |
| Bubis Edward | $41,500 | -- | |
| Bubis Edward | $41,500 | -- | |
| Johnson Robert A | $55,000 | -- | |
| Johnson Robert A | $55,000 | -- |
Source: Public Records
Mortgage History
| Date | Status | Borrower | Loan Amount |
|---|---|---|---|
| Previous Owner | Johnson Robert A | $312,112 | |
| Previous Owner | Johnson Robert A | $216,000 |
Source: Public Records
Tax History
| Year | Tax Paid | Tax Assessment Tax Assessment Total Assessment is a certain percentage of the fair market value that is determined by local assessors to be the total taxable value of land and additions on the property. | Land | Improvement |
|---|---|---|---|---|
| 2025 | $4,141 | $368,700 | $90,000 | $278,700 |
| 2024 | $3,622 | $249,100 | $91,600 | $157,500 |
| 2023 | $3,482 | $249,100 | $91,600 | $157,500 |
| 2022 | $3,482 | $249,100 | $91,600 | $157,500 |
| 2021 | $2,955 | $124,400 | $37,400 | $87,000 |
| 2020 | $2,986 | $124,400 | $37,400 | $87,000 |
| 2018 | $2,996 | $124,400 | $37,400 | $87,000 |
| 2017 | $3,323 | $110,400 | $40,900 | $69,500 |
| 2016 | $3,515 | $110,400 | $40,900 | $69,500 |
| 2015 | $4,038 | $110,400 | $40,900 | $69,500 |
| 2014 | $3,932 | $109,400 | $45,000 | $64,400 |
Source: Public Records
Map
Nearby Homes
- 42 Transit St
- 0 Holbrook Ln Unit 1402850
- 120 East St
- 122 Grand St
- 379 Front St
- 635 Park Ave
- 43 Summit St
- 190 Coe St
- 435 S Main St
- 15 Knight St
- 184 Avenue C Unit 2
- 184 Avenue C Unit 5
- 184 Avenue C Unit 6
- 184 Avenue C Unit 3
- 184 Avenue C Unit 4
- 184 Avenue C Unit 1
- 99 Allen St Unit 205
- 372 River St
- 83 4th Ave
- 180 Allen St Unit 104
Your Personal Tour Guide
Ask me questions while you tour the home.