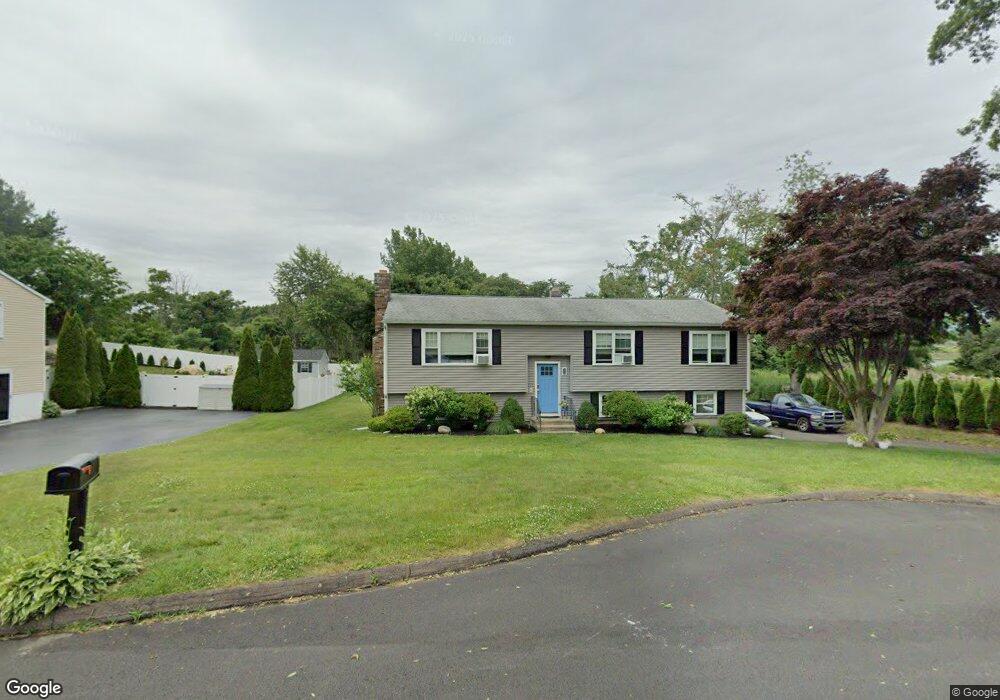
28 Weir St Branford, CT 06405
Estimated Value: $439,000 - $484,656
3
Beds
2
Baths
1,294
Sq Ft
$355/Sq Ft
Est. Value
About This Home
This home is located at 28 Weir St, Branford, CT 06405 and is currently estimated at $458,914, approximately $354 per square foot. 28 Weir St is a home located in New Haven County with nearby schools including Francis Walsh Intermediate School, Branford High School, and St Mary School.
Ownership History
Date
Name
Owned For
Owner Type
Purchase Details
Closed on
Mar 5, 2010
Sold by
Kelly Anne D
Bought by
Ammerer Edwin E and Ammerer Teresa L
Current Estimated Value
Home Financials for this Owner
Home Financials are based on the most recent Mortgage that was taken out on this home.
Original Mortgage
$231,200
Outstanding Balance
$153,388
Interest Rate
5%
Estimated Equity
$305,526
Purchase Details
Closed on
Jul 7, 2008
Sold by
Ridarelli Joseph O and Ridarelli Susan L
Bought by
Kelly Anne D
Home Financials for this Owner
Home Financials are based on the most recent Mortgage that was taken out on this home.
Original Mortgage
$162,000
Interest Rate
6.01%
Purchase Details
Closed on
Jul 13, 1990
Sold by
Loos Adele M
Bought by
Ridarelli Joseph U
Create a Home Valuation Report for This Property
The Home Valuation Report is an in-depth analysis detailing your home's value as well as a comparison with similar homes in the area
Home Values in the Area
Average Home Value in this Area
Purchase History
| Date | Buyer | Sale Price | Title Company |
|---|---|---|---|
| Ammerer Edwin E | $289,000 | -- | |
| Kelly Anne D | $262,000 | -- | |
| Ridarelli Joseph U | $172,000 | -- |
Source: Public Records
Mortgage History
| Date | Status | Borrower | Loan Amount |
|---|---|---|---|
| Open | Ridarelli Joseph U | $231,200 | |
| Previous Owner | Ridarelli Joseph U | $162,000 | |
| Previous Owner | Ridarelli Joseph U | $109,074 | |
| Previous Owner | Ridarelli Joseph U | $125,500 |
Source: Public Records
Tax History Compared to Growth
Tax History
| Year | Tax Paid | Tax Assessment Tax Assessment Total Assessment is a certain percentage of the fair market value that is determined by local assessors to be the total taxable value of land and additions on the property. | Land | Improvement |
|---|---|---|---|---|
| 2025 | $6,702 | $313,200 | $109,400 | $203,800 |
| 2024 | $5,788 | $189,900 | $86,200 | $103,700 |
| 2023 | $5,676 | $189,900 | $86,200 | $103,700 |
| 2022 | $5,593 | $189,900 | $86,200 | $103,700 |
| 2021 | $5,593 | $189,900 | $86,200 | $103,700 |
| 2020 | $5,492 | $189,900 | $86,200 | $103,700 |
| 2019 | $5,570 | $191,600 | $89,000 | $102,600 |
| 2018 | $5,487 | $191,600 | $89,000 | $102,600 |
| 2017 | $5,455 | $191,600 | $89,000 | $102,600 |
| 2016 | $5,252 | $191,600 | $89,000 | $102,600 |
| 2015 | $5,160 | $191,600 | $89,000 | $102,600 |
| 2014 | $5,295 | $201,800 | $99,200 | $102,600 |
Source: Public Records
Map
Nearby Homes
- 62 S Montowese St
- 25 S Montowese St
- 16 Pine Orchard Rd Unit 23
- 60 Maple St Unit 40B
- 74 Quarry Dock Rd
- 58 Quarry Dock Rd
- 86 Pine Orchard Rd
- 42 Waverly Rd
- 49 Riverside Dr
- 85 Ivy St
- 21 Harbor St
- 76 Limewood Ave
- 40 Linden Shores
- 26 N Main St Unit TRLR 19
- 301 Maple St
- 15 River Rd
- 18 Linsley St
- 26 Cedar Knolls Dr
- 251 N Main St
- 29 Harbour Village Unit D