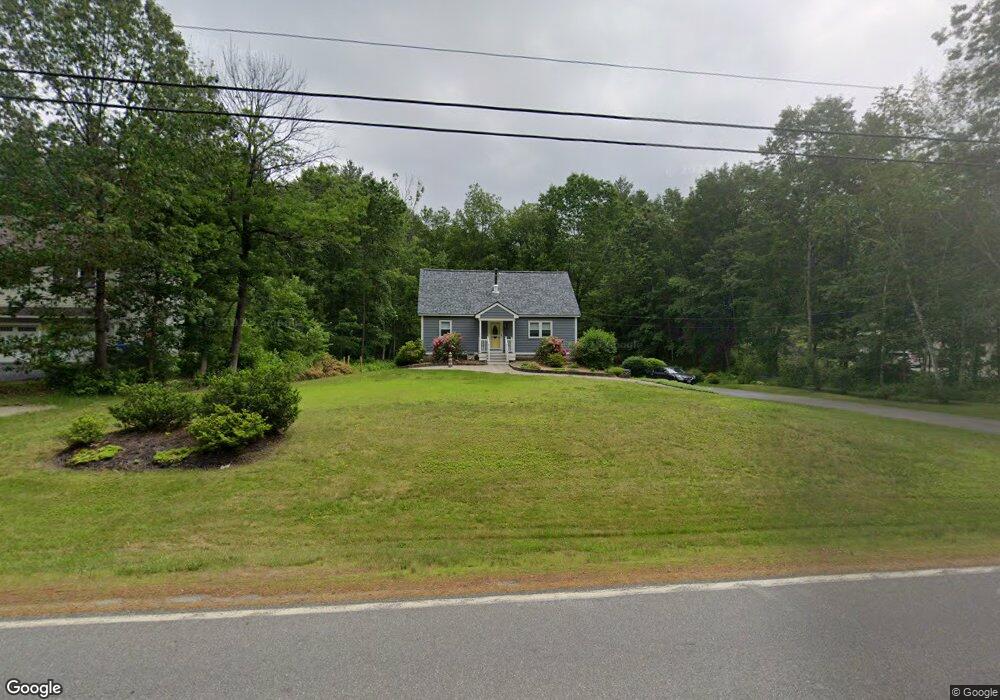
28 West Rd Londonderry, NH 03053
Estimated Value: $397,000 - $541,000
3
Beds
2
Baths
1,460
Sq Ft
$342/Sq Ft
Est. Value
About This Home
This home is located at 28 West Rd, Londonderry, NH 03053 and is currently estimated at $498,617, approximately $341 per square foot. 28 West Rd is a home with nearby schools including Matthew Thornton Elementary School, Londonderry Middle School, and Londonderry Senior High School.
Ownership History
Date
Name
Owned For
Owner Type
Purchase Details
Closed on
Aug 17, 2021
Sold by
Martin Nancy J
Bought by
Nancy J Martin Ret
Current Estimated Value
Purchase Details
Closed on
Apr 24, 1998
Sold by
Osadchy Thomas S and Osadchy Cheryl A
Bought by
Martin Dennis J and Martin Nancy J
Create a Home Valuation Report for This Property
The Home Valuation Report is an in-depth analysis detailing your home's value as well as a comparison with similar homes in the area
Home Values in the Area
Average Home Value in this Area
Purchase History
| Date | Buyer | Sale Price | Title Company |
|---|---|---|---|
| Nancy J Martin Ret | -- | None Available | |
| Martin Dennis J | $129,300 | -- |
Source: Public Records
Mortgage History
| Date | Status | Borrower | Loan Amount |
|---|---|---|---|
| Previous Owner | Martin Dennis J | $164,700 | |
| Previous Owner | Martin Dennis J | $4,295,000 | |
| Previous Owner | Martin Dennis J | $5,270,000 | |
| Previous Owner | Martin Dennis J | $25,000 |
Source: Public Records
Tax History Compared to Growth
Tax History
| Year | Tax Paid | Tax Assessment Tax Assessment Total Assessment is a certain percentage of the fair market value that is determined by local assessors to be the total taxable value of land and additions on the property. | Land | Improvement |
|---|---|---|---|---|
| 2024 | $6,419 | $397,700 | $183,900 | $213,800 |
| 2023 | $6,224 | $397,700 | $183,900 | $213,800 |
| 2022 | $6,159 | $333,300 | $138,100 | $195,200 |
| 2021 | $6,126 | $333,300 | $138,100 | $195,200 |
| 2020 | $6,061 | $301,400 | $115,300 | $186,100 |
| 2019 | $5,844 | $301,400 | $115,300 | $186,100 |
| 2018 | $5,437 | $249,400 | $95,700 | $153,700 |
| 2017 | $5,390 | $249,400 | $95,700 | $153,700 |
| 2016 | $5,362 | $249,400 | $95,700 | $153,700 |
| 2015 | $5,242 | $249,400 | $95,700 | $153,700 |
| 2014 | $5,260 | $249,400 | $95,700 | $153,700 |
| 2011 | -- | $253,000 | $95,700 | $157,300 |
Source: Public Records
Map
Nearby Homes
- 4 Sunset Dr Unit A
- 4 Quincy Rd
- 4 Quincy Rd Unit A
- 10 Jason Dr
- 4 Delphi Way
- 1 Delphi Way
- 1 Delphi Way Unit 10
- 15 Alan Cir
- 5 Delphi Way
- 3 Delphi Way
- 7 Delphi Way
- 3 Acadia Dr Unit 2-7
- 8 Acadia Dr
- 31 Page Rd Unit 20
- 12 Louise Dr
- 69 Bayberry Ln
- 4 Bayberry Ln
- 20 Locke Mill Dr
- 95 Bayberry Ln
- 12 Wiley Hill Rd