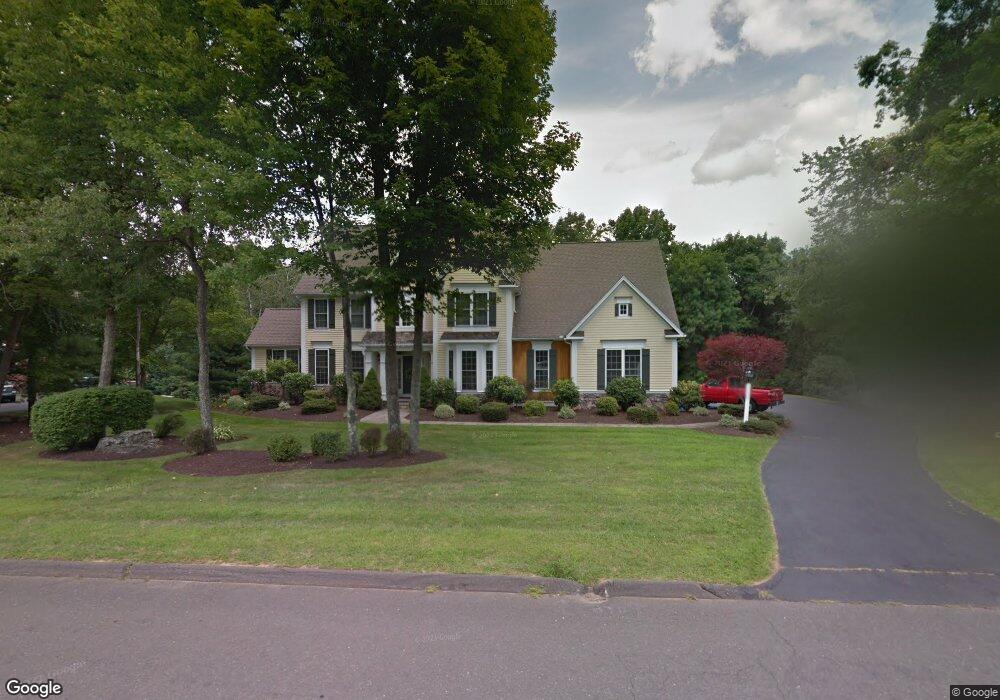
28 Wilders Pass Canton, CT 06019
Estimated Value: $847,171 - $918,000
4
Beds
4
Baths
3,521
Sq Ft
$249/Sq Ft
Est. Value
About This Home
This home is located at 28 Wilders Pass, Canton, CT 06019 and is currently estimated at $877,043, approximately $249 per square foot. 28 Wilders Pass is a home located in Hartford County with nearby schools including Cherry Brook Primary School, Canton Intermediate School, and Canton Middle School.
Ownership History
Date
Name
Owned For
Owner Type
Purchase Details
Closed on
Dec 17, 2008
Sold by
Kurtz 4Th Thomas R and Kurtz Elizabeth L
Bought by
Forte William W and Forte Julie A
Current Estimated Value
Home Financials for this Owner
Home Financials are based on the most recent Mortgage that was taken out on this home.
Original Mortgage
$50,000
Interest Rate
6.27%
Purchase Details
Closed on
Jun 5, 2006
Sold by
Sheehan Daniel J and Sheehan Michalle L
Bought by
Fncl Cendant Mobility
Purchase Details
Closed on
Feb 15, 2001
Sold by
Stedman Anthony O and Stedman Lisa R
Bought by
Sheehan Daniel J and Sheehan Michelle L
Purchase Details
Closed on
Jan 18, 2000
Sold by
Meehan Group Llc
Bought by
Stedman Anthony O
Create a Home Valuation Report for This Property
The Home Valuation Report is an in-depth analysis detailing your home's value as well as a comparison with similar homes in the area
Home Values in the Area
Average Home Value in this Area
Purchase History
| Date | Buyer | Sale Price | Title Company |
|---|---|---|---|
| Forte William W | $625,000 | -- | |
| Forte William W | $625,000 | -- | |
| Fncl Cendant Mobility | $735,000 | -- | |
| Cendant Mobility Fncl | $735,000 | -- | |
| Sheehan Daniel J | $550,000 | -- | |
| Sheehan Daniel J | $550,000 | -- | |
| Stedman Anthony O | $470,000 | -- | |
| Stedman Anthony O | $470,000 | -- |
Source: Public Records
Mortgage History
| Date | Status | Borrower | Loan Amount |
|---|---|---|---|
| Open | Stedman Anthony O | $400,000 | |
| Closed | Stedman Anthony O | $50,000 |
Source: Public Records
Tax History Compared to Growth
Tax History
| Year | Tax Paid | Tax Assessment Tax Assessment Total Assessment is a certain percentage of the fair market value that is determined by local assessors to be the total taxable value of land and additions on the property. | Land | Improvement |
|---|---|---|---|---|
| 2025 | $16,738 | $499,640 | $107,400 | $392,240 |
| 2024 | $17,063 | $499,640 | $107,400 | $392,240 |
| 2023 | $12,448 | $351,930 | $97,100 | $254,830 |
| 2022 | $11,857 | $351,930 | $97,100 | $254,830 |
| 2021 | $11,691 | $351,930 | $97,100 | $254,830 |
| 2020 | $11,247 | $345,100 | $97,100 | $248,000 |
| 2019 | $11,054 | $345,100 | $97,100 | $248,000 |
| 2018 | $12,943 | $421,580 | $105,000 | $316,580 |
| 2017 | $12,854 | $421,580 | $105,000 | $316,580 |
| 2016 | $12,546 | $421,580 | $105,000 | $316,580 |
| 2015 | $12,306 | $421,580 | $105,000 | $316,580 |
| 2014 | $12,040 | $421,580 | $105,000 | $316,580 |
Source: Public Records
Map
Nearby Homes
- 152 E Hill Rd
- 10 Mountain Spring Rd
- 50 E Hill Rd Unit 4A
- 42 Garrett Rd
- 40 E Hill Rd
- 121 Gracey Rd
- 85 Dowd Ave Unit 89
- 455 Dowd Ave Unit 455
- 141 Dowd Ave
- 15 Red Fox Run
- 96 Dyer Ave
- 41 Applegate Ln
- 31 Applegate Ln Unit 31
- 49 Applegate Ln Unit 49
- 207 Cherry Brook Rd
- 23 Red Fox Run
- 3 Bridle Path
- 56 Wickhams Fancy Unit 56
- 269 W Mountain Rd
- 25 Maple Ave
- 22 Wilders Pass
- 14 Wilders Pass
- 45 Wilders Pass
- 21 Wilders Pass
- 141 E Hill Rd
- 15 Wilders Pass
- 151 E Hill Rd
- 48 Wilders Pass
- 153 E Hill Rd
- 57 Wilders Pass
- 146 E Hill Rd
- 157 E Hill Rd
- 150 E Hill Rd
- 134 E Hill Rd
- 0 Mountain Springs
- 15 Mountain Spring Rd
- 15 Mountain Spring Rd
- 111 E Hill Rd
- 54 Wilders Pass
- 196 Bahre Corner Rd