Estimated Value: $244,615 - $297,000
2
Beds
2
Baths
853
Sq Ft
$312/Sq Ft
Est. Value
About This Home
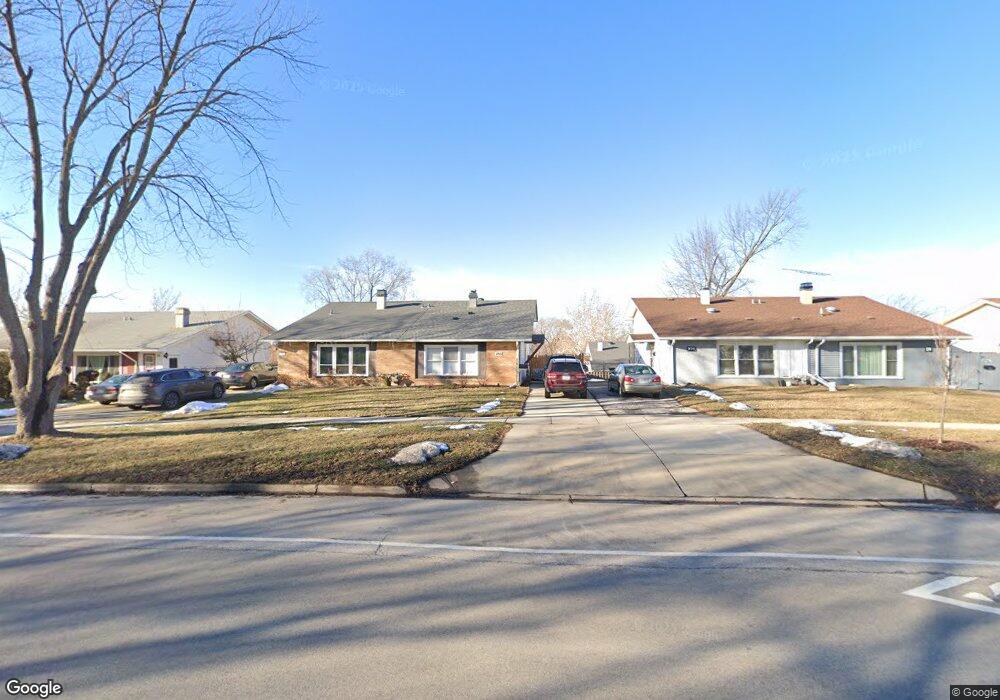
This home is located at 280 Bode Rd, Hoffman Estates, IL 60169 and is currently estimated at $265,904, approximately $311 per square foot. 280 Bode Rd is a home located in Cook County with nearby schools including Lakeview Elementary School, Helen Keller Junior High School, and J B Conant High School.
Ownership History
Date
Name
Owned For
Owner Type
Purchase Details
Closed on
Feb 27, 2023
Sold by
Kendall Partners Ltd
Bought by
Tmh Investing Inc
Current Estimated Value
Home Financials for this Owner
Home Financials are based on the most recent Mortgage that was taken out on this home.
Original Mortgage
$150,500
Interest Rate
6.32%
Mortgage Type
FHA
Purchase Details
Closed on
Feb 15, 2023
Sold by
Carlborg Zakary R
Bought by
Kendall Partners Ltd
Home Financials for this Owner
Home Financials are based on the most recent Mortgage that was taken out on this home.
Original Mortgage
$150,500
Interest Rate
6.32%
Mortgage Type
FHA
Purchase Details
Closed on
May 1, 2019
Sold by
Keller Robert
Bought by
Carlborg Zakary R
Home Financials for this Owner
Home Financials are based on the most recent Mortgage that was taken out on this home.
Original Mortgage
$168,547
Interest Rate
4.62%
Mortgage Type
VA
Create a Home Valuation Report for This Property
The Home Valuation Report is an in-depth analysis detailing your home's value as well as a comparison with similar homes in the area
Home Values in the Area
Average Home Value in this Area
Purchase History
| Date | Buyer | Sale Price | Title Company |
|---|---|---|---|
| Tmh Investing Inc | $215,000 | Chicago Title | |
| Kendall Partners Ltd | $188,000 | Chicago Title | |
| Carlborg Zakary R | $165,000 | National Title Solutions Inc |
Source: Public Records
Mortgage History
| Date | Status | Borrower | Loan Amount |
|---|---|---|---|
| Previous Owner | Tmh Investing Inc | $150,500 | |
| Previous Owner | Carlborg Zakary R | $168,547 |
Source: Public Records
Tax History
| Year | Tax Paid | Tax Assessment Tax Assessment Total Assessment is a certain percentage of the fair market value that is determined by local assessors to be the total taxable value of land and additions on the property. | Land | Improvement |
|---|---|---|---|---|
| 2025 | $5,830 | $22,000 | $3,906 | $18,094 |
| 2024 | $5,830 | $19,000 | $3,500 | $15,500 |
| 2023 | $5,642 | $19,000 | $3,500 | $15,500 |
| 2022 | $5,642 | $19,000 | $3,500 | $15,500 |
| 2021 | $5,175 | $15,445 | $3,906 | $11,539 |
| 2020 | $5,054 | $15,445 | $3,906 | $11,539 |
| 2019 | $4,077 | $17,354 | $3,906 | $13,448 |
| 2018 | $4,072 | $15,923 | $3,255 | $12,668 |
| 2017 | $4,019 | $15,923 | $3,255 | $12,668 |
| 2016 | $4,000 | $15,923 | $3,255 | $12,668 |
| 2015 | $3,652 | $13,994 | $2,848 | $11,146 |
| 2014 | $3,605 | $13,994 | $2,848 | $11,146 |
| 2013 | $3,494 | $13,994 | $2,848 | $11,146 |
Source: Public Records
Map
Nearby Homes
- 367 Juniper Tree Ct Unit 3
- 945 Morton St
- 368 Willow Tree Ct
- 988 Butter Creek Ct Unit 4ND
- 829 Linden Cir
- 625 Morton St
- 600 Baxter Ln
- 345 Maricopa Ln
- 630 Bode Rd
- 480 Illinois Blvd
- 75 Carthage Ln
- 600 Mesa Dr Unit 103
- 200 W Thacker St
- 670 Lakeview Ln
- 1180 Meadow Ln Unit 6306
- 260 Mohave St
- 1045 Higgins Quarters Dr Unit 4-101
- 1025 Higgins Quarters Dr Unit 4-109
- 720 Hill Dr Unit 8303
- 730 Hill Dr Unit 9205
Your Personal Tour Guide
Ask me questions while you tour the home.