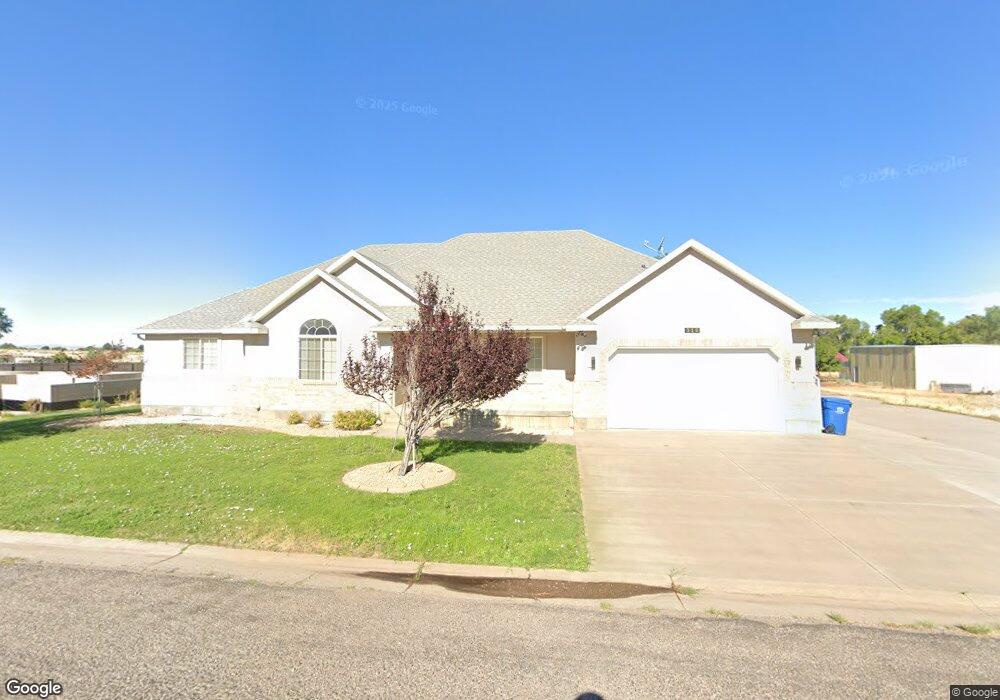
280 S 600 E Fillmore, UT 84631
Estimated Value: $379,481 - $520,000
5
Beds
2
Baths
2,371
Sq Ft
$182/Sq Ft
Est. Value
About This Home
This home is located at 280 S 600 E, Fillmore, UT 84631 and is currently estimated at $430,870, approximately $181 per square foot. 280 S 600 E is a home located in Millard County.
Ownership History
Date
Name
Owned For
Owner Type
Purchase Details
Closed on
Feb 13, 2019
Sold by
Bartholoncen Michael G
Bought by
Bartholo Michael G and Bartholoncen Arlene C
Current Estimated Value
Purchase Details
Closed on
Dec 1, 2017
Sold by
Becker Thomas P
Bought by
Bartholomew Michael G
Purchase Details
Closed on
Jul 31, 2007
Sold by
Hancox Maitland K
Bought by
Slavens James K and Slavens Melanie
Home Financials for this Owner
Home Financials are based on the most recent Mortgage that was taken out on this home.
Original Mortgage
$61,181
Interest Rate
6.62%
Create a Home Valuation Report for This Property
The Home Valuation Report is an in-depth analysis detailing your home's value as well as a comparison with similar homes in the area
Home Values in the Area
Average Home Value in this Area
Purchase History
| Date | Buyer | Sale Price | Title Company |
|---|---|---|---|
| Bartholo Michael G | -- | None Available | |
| Bartholomew Michael G | -- | First American Title | |
| Slavens James K | -- | -- |
Source: Public Records
Mortgage History
| Date | Status | Borrower | Loan Amount |
|---|---|---|---|
| Previous Owner | Slavens James K | $61,181 |
Source: Public Records
Tax History
| Year | Tax Paid | Tax Assessment Tax Assessment Total Assessment is a certain percentage of the fair market value that is determined by local assessors to be the total taxable value of land and additions on the property. | Land | Improvement |
|---|---|---|---|---|
| 2025 | $1,721 | $216,172 | $22,696 | $193,476 |
| 2024 | $1,721 | $190,969 | $16,771 | $174,198 |
| 2023 | $1,972 | $190,969 | $16,771 | $174,198 |
| 2022 | $1,564 | $140,459 | $15,246 | $125,213 |
| 2021 | $1,427 | $122,992 | $12,705 | $110,287 |
| 2020 | $1,318 | $114,332 | $11,550 | $102,782 |
| 2019 | $1,117 | $97,167 | $11,550 | $85,617 |
| 2018 | $1,061 | $94,472 | $11,550 | $82,922 |
| 2017 | $783 | $66,289 | $11,550 | $54,739 |
| 2016 | $749 | $66,289 | $11,550 | $54,739 |
| 2015 | $749 | $66,289 | $11,550 | $54,739 |
| 2014 | -- | $66,289 | $11,550 | $54,739 |
| 2013 | -- | $66,289 | $11,550 | $54,739 |
Source: Public Records
Map
Nearby Homes
- 430 E Canyon Rd
- 690 E 500 S
- 750 800 South Fillmore
- 825 800 South Fillmore
- 800 800 South Fillmore
- 235 S 200 St E
- 405 E 500 St S
- 157 E 500 South St
- 155 E 500 St S
- 775 E Valley View Rd
- 760 E 700 St S
- 40 S 100 Rd E
- 465 S 100 W
- 190 W 400 St S
- 155 W Center St
- 75 N 100 West St
- 190 S 200 W
- 290 W 200 S
- 351 W 100 South St
- 225 W 200 St N
Your Personal Tour Guide
Ask me questions while you tour the home.