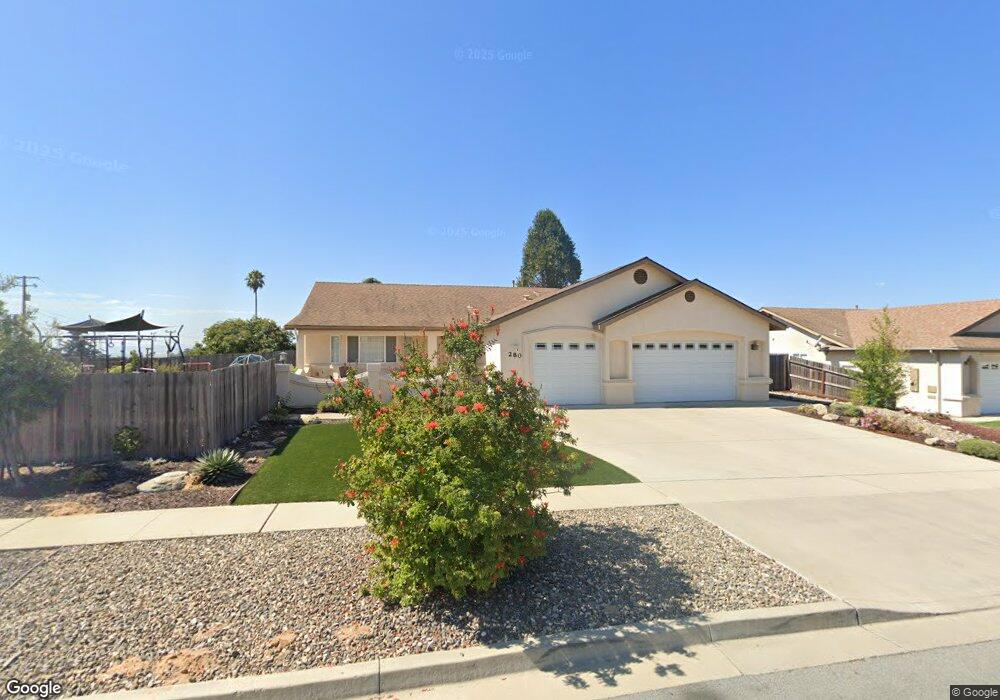
280 S Tejas Place Unit 1 Nipomo, CA 93444
Estimated Value: $928,000 - $1,110,000
3
Beds
3
Baths
2,404
Sq Ft
$438/Sq Ft
Est. Value
About This Home
This home is located at 280 S Tejas Place Unit 1, Nipomo, CA 93444 and is currently estimated at $1,051,757, approximately $437 per square foot. 280 S Tejas Place Unit 1 is a home located in San Luis Obispo County with nearby schools including Dana Elementary School, Mesa Middle School, and Nipomo High School.
Ownership History
Date
Name
Owned For
Owner Type
Purchase Details
Closed on
May 14, 2013
Sold by
Briar Rose Estates Llc
Bought by
Laferriere Timothy and Laferriere Kelly
Current Estimated Value
Home Financials for this Owner
Home Financials are based on the most recent Mortgage that was taken out on this home.
Original Mortgage
$417,000
Interest Rate
3.88%
Mortgage Type
New Conventional
Purchase Details
Closed on
Nov 15, 2012
Sold by
Leal Henry and Leal Alice Mary
Bought by
Briar Rose Estates Llc
Home Financials for this Owner
Home Financials are based on the most recent Mortgage that was taken out on this home.
Original Mortgage
$391,000
Interest Rate
3.31%
Mortgage Type
Construction
Purchase Details
Closed on
Apr 30, 1999
Sold by
Simmons Kenneth R and Simmons Sylvia J
Bought by
Leal Henry and Leal Alice Mary
Home Financials for this Owner
Home Financials are based on the most recent Mortgage that was taken out on this home.
Original Mortgage
$70,000
Interest Rate
7.2%
Create a Home Valuation Report for This Property
The Home Valuation Report is an in-depth analysis detailing your home's value as well as a comparison with similar homes in the area
Home Values in the Area
Average Home Value in this Area
Purchase History
| Date | Buyer | Sale Price | Title Company |
|---|---|---|---|
| Laferriere Timothy | $535,000 | First American Title Company | |
| Briar Rose Estates Llc | $285,000 | First American Title Company | |
| Leal Henry | $100,000 | Chicago Title Co |
Source: Public Records
Mortgage History
| Date | Status | Borrower | Loan Amount |
|---|---|---|---|
| Previous Owner | Laferriere Timothy | $417,000 | |
| Previous Owner | Briar Rose Estates Llc | $391,000 | |
| Previous Owner | Leal Henry | $70,000 |
Source: Public Records
Tax History Compared to Growth
Tax History
| Year | Tax Paid | Tax Assessment Tax Assessment Total Assessment is a certain percentage of the fair market value that is determined by local assessors to be the total taxable value of land and additions on the property. | Land | Improvement |
|---|---|---|---|---|
| 2025 | $7,655 | $744,257 | $263,554 | $480,703 |
| 2024 | $7,568 | $729,665 | $258,387 | $471,278 |
| 2023 | $7,568 | $715,359 | $253,321 | $462,038 |
| 2022 | $6,568 | $618,000 | $248,354 | $369,646 |
| 2021 | $6,556 | $605,884 | $243,485 | $362,399 |
| 2020 | $6,481 | $599,673 | $240,989 | $358,684 |
| 2019 | $6,441 | $587,915 | $236,264 | $351,651 |
| 2018 | $6,364 | $576,388 | $231,632 | $344,756 |
| 2017 | $6,245 | $565,088 | $227,091 | $337,997 |
| 2016 | $5,890 | $554,009 | $222,639 | $331,370 |
| 2015 | $5,806 | $545,688 | $219,295 | $326,393 |
| 2014 | $5,590 | $535,000 | $215,000 | $320,000 |
Source: Public Records
Map
Nearby Homes
- 261 Hazel Ln
- 426 Polaris Dr
- 457 Polaris Dr
- 393 Uranus Ct
- 945 Jeanette Ln
- 1127 Starlite Dr
- 1180 Starlite Dr
- 522 Higos Way
- 483 Violet Ave
- 468 Neptune Dr
- 232 Scarlett Cir
- 719 W Tefft St
- 840 Story St
- Mesa Plan at Hill Street Terraces - Hill Street Series
- Pacific Plan at Hill Street Terraces - Hill Street Series
- Monarch Plan at Hill Street Terraces - Hill Street Series
- Rancho Plan at Hill Street Terraces - Hill Street Series
- Dana Plan at Hill Street Terraces - Hill Street Series
- 680 Hill St
- 759 Viola Ct
- 280 S Tejas Place
- 270 S Tejas Place
- 270 S Tejas Place
- 285 Tejas Place
- 291 S Tejas Place
- 275 S Tejas Place
- 295 S Tejas Place
- 265 S Tejas Place
- 245 Martha Ln
- 1022 Grande Ave
- 245 S Tejas Place
- 280 Cyclone St
- 290 Cyclone St
- 244 S Tejas Place
- 270 Cyclone St
- 971 Grande Ave
- 235 Martha Ln
- 250 Martha Ln
- 250 Cyclone St