2800 N Main St Newberg, OR 97132
Estimated Value: $538,372 - $629,000
3
Beds
2
Baths
1,785
Sq Ft
$328/Sq Ft
Est. Value
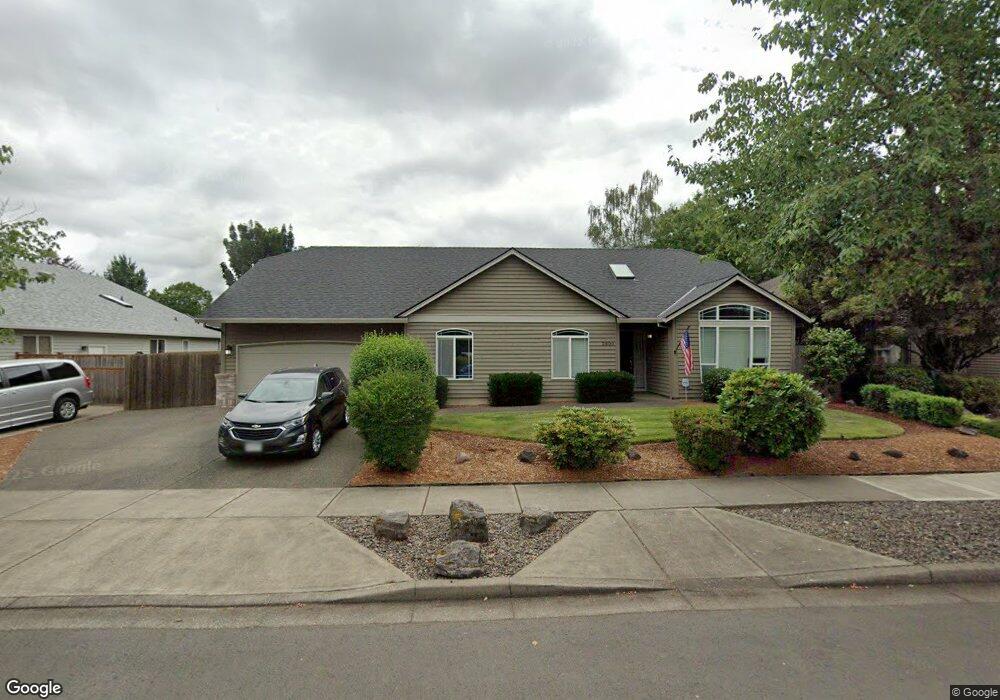
About This Home
This home is located at 2800 N Main St, Newberg, OR 97132 and is currently estimated at $584,843, approximately $327 per square foot. 2800 N Main St is a home located in Yamhill County with nearby schools including Antonia Crater Elementary School, Chehalem Valley Middle School, and Newberg Senior High School.
Ownership History
Date
Name
Owned For
Owner Type
Purchase Details
Closed on
Sep 30, 2009
Sold by
Campbell David R and Campbell Jane B
Bought by
Brown Jonathan M and Brown Christy A
Current Estimated Value
Home Financials for this Owner
Home Financials are based on the most recent Mortgage that was taken out on this home.
Original Mortgage
$292,111
Outstanding Balance
$189,191
Interest Rate
5.08%
Mortgage Type
FHA
Estimated Equity
$395,652
Purchase Details
Closed on
Aug 3, 2006
Sold by
Campbell David R and Campbell Jane B
Bought by
Campbell David R and Campbell Jane B
Purchase Details
Closed on
Oct 17, 2005
Sold by
Mcdonald Daniel J and Mcdonald Living Trust
Bought by
Campbell David R and Campbell Jane B
Home Financials for this Owner
Home Financials are based on the most recent Mortgage that was taken out on this home.
Original Mortgage
$230,500
Interest Rate
5.63%
Mortgage Type
Fannie Mae Freddie Mac
Create a Home Valuation Report for This Property
The Home Valuation Report is an in-depth analysis detailing your home's value as well as a comparison with similar homes in the area
Home Values in the Area
Average Home Value in this Area
Purchase History
| Date | Buyer | Sale Price | Title Company |
|---|---|---|---|
| Brown Jonathan M | $297,500 | Ticor Title Insurance Co | |
| Campbell David R | -- | None Available | |
| Campbell David R | $295,500 | Multiple |
Source: Public Records
Mortgage History
| Date | Status | Borrower | Loan Amount |
|---|---|---|---|
| Open | Brown Jonathan M | $292,111 | |
| Previous Owner | Campbell David R | $230,500 |
Source: Public Records
Tax History Compared to Growth
Tax History
| Year | Tax Paid | Tax Assessment Tax Assessment Total Assessment is a certain percentage of the fair market value that is determined by local assessors to be the total taxable value of land and additions on the property. | Land | Improvement |
|---|---|---|---|---|
| 2025 | $4,475 | $277,338 | -- | -- |
| 2024 | $4,304 | $269,260 | -- | -- |
| 2023 | $4,156 | $261,417 | $0 | $0 |
| 2022 | $4,045 | $253,803 | $0 | $0 |
| 2021 | $3,935 | $246,411 | $0 | $0 |
| 2020 | $3,544 | $239,234 | $0 | $0 |
| 2019 | $3,496 | $232,266 | $0 | $0 |
| 2018 | $3,515 | $225,501 | $0 | $0 |
| 2017 | $3,736 | $218,933 | $0 | $0 |
| 2016 | $3,660 | $212,556 | $0 | $0 |
| 2015 | $3,595 | $206,367 | $0 | $0 |
| 2014 | $3,353 | $200,359 | $0 | $0 |
Source: Public Records
Map
Nearby Homes
- 2708 N Main St
- 2750 Holiday Ln
- 110 W Oxford
- 325 Peacock Ct
- 440 Kemper Crest Dr
- 1412 E Canto St
- 1336 S Canto St
- 1400 E Canto St
- 2468 N Vale St
- 3300 Morris St
- 514 E Melody Ln
- 2080 NE Chehalem Dr
- 3229 N Meridian St
- 301 E Columbia Dr Unit 57
- 301 E Columbia Dr Unit 61
- 2450 N Vale St
- 1801 N Daniel Dr
- 2817 Estate St
- 2918 Juniper Dr
- 819 Alexandra Dr
- 2722 N Main St
- 2808 N Main St
- 315 Cambridge Dr
- 309 Cambridge Dr
- 2718 N Main St
- 2916 N Main St
- 319 Cambridge Dr
- 307 Cambridge Dr
- 325 Cambridge Dr
- 2756 Holiday Ln
- 200 E Myrtlewood Ct
- 2712 N Main St
- 102 W Myrtlewood Dr
- 2926 N Main St
- 2755 Holiday Ln
- 305 Cambridge Dr
- 204 E Myrtlewood Ct
- 401 Cambridge Dr
- 2719 N Main St
- 108 W Myrtlewood Dr