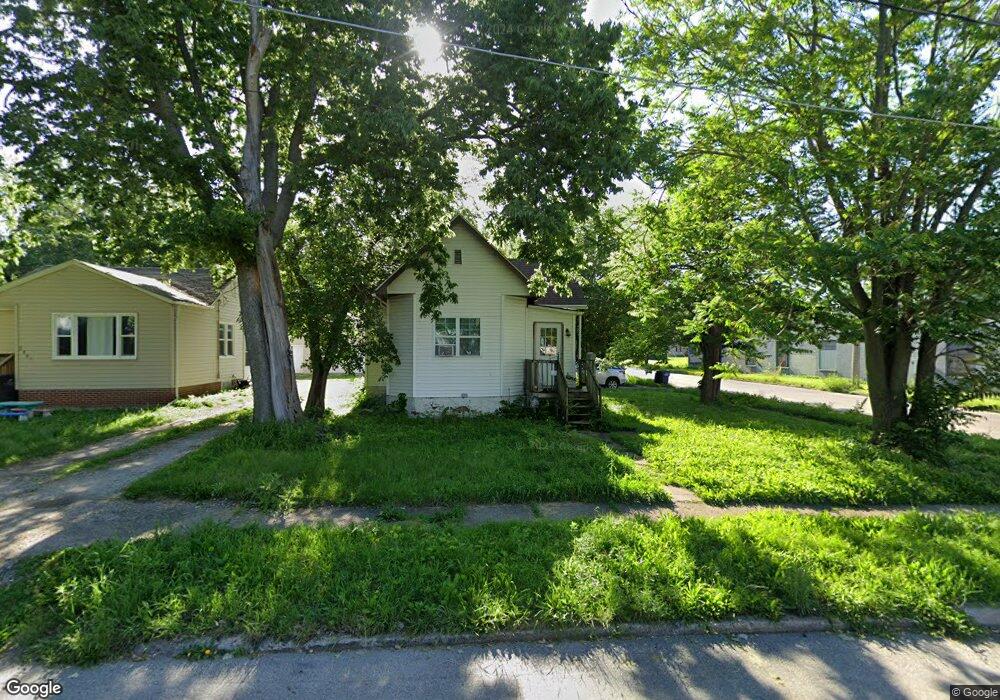
2801 1st St Des Moines, IA 50313
Union Park NeighborhoodEstimated Value: $97,000 - $165,000
2
Beds
1
Bath
956
Sq Ft
$143/Sq Ft
Est. Value
About This Home
This home is located at 2801 1st St, Des Moines, IA 50313 and is currently estimated at $137,111, approximately $143 per square foot. 2801 1st St is a home located in Polk County with nearby schools including Findley Elementary School, Harding Middle School, and North High School.
Ownership History
Date
Name
Owned For
Owner Type
Purchase Details
Closed on
May 23, 2025
Sold by
Mcmillen Jennifer and Mcmillen Kade
Bought by
Cwf 2025 Llc
Current Estimated Value
Home Financials for this Owner
Home Financials are based on the most recent Mortgage that was taken out on this home.
Original Mortgage
$112,160
Outstanding Balance
$111,761
Interest Rate
6.62%
Mortgage Type
Construction
Estimated Equity
$25,351
Purchase Details
Closed on
Mar 23, 2017
Sold by
Living The Ultimate Dream Llc
Bought by
Mcmillen Jennifer and Mcmillen Kade
Purchase Details
Closed on
Mar 22, 2017
Sold by
Fbc Math & Science Academy
Bought by
Living The Ultimate Dream Llc
Purchase Details
Closed on
Dec 7, 2012
Sold by
Fbc Maith & Science Academy
Bought by
Livng The Dean Llc
Purchase Details
Closed on
Jun 22, 2012
Sold by
Flatirons Financial Inc
Bought by
Fbc Math And Science Academy
Purchase Details
Closed on
Feb 9, 2012
Sold by
Towers Steve and Towers Karen
Bought by
Flatirons Financial Inc
Purchase Details
Closed on
Jun 4, 2010
Sold by
Wealth Trust
Bought by
Hebd Paul and Hiatt Bethany
Home Financials for this Owner
Home Financials are based on the most recent Mortgage that was taken out on this home.
Original Mortgage
$73,000
Interest Rate
4.26%
Mortgage Type
Seller Take Back
Create a Home Valuation Report for This Property
The Home Valuation Report is an in-depth analysis detailing your home's value as well as a comparison with similar homes in the area
Home Values in the Area
Average Home Value in this Area
Purchase History
| Date | Buyer | Sale Price | Title Company |
|---|---|---|---|
| Cwf 2025 Llc | $95,000 | None Listed On Document | |
| Cwf 2025 Llc | $95,000 | None Listed On Document | |
| Mcmillen Jennifer | $78,000 | None Available | |
| Living The Ultimate Dream Llc | -- | None Available | |
| Livng The Dean Llc | $22,000 | None Available | |
| Fbc Math And Science Academy | -- | None Available | |
| Flatirons Financial Inc | $39,950 | None Available | |
| Hebd Paul | $76,000 | None Available |
Source: Public Records
Mortgage History
| Date | Status | Borrower | Loan Amount |
|---|---|---|---|
| Open | Cwf 2025 Llc | $112,160 | |
| Closed | Cwf 2025 Llc | $112,160 | |
| Previous Owner | Hebd Paul | $73,000 |
Source: Public Records
Tax History Compared to Growth
Tax History
| Year | Tax Paid | Tax Assessment Tax Assessment Total Assessment is a certain percentage of the fair market value that is determined by local assessors to be the total taxable value of land and additions on the property. | Land | Improvement |
|---|---|---|---|---|
| 2025 | $1,890 | $122,000 | $21,200 | $100,800 |
| 2024 | $1,890 | $106,500 | $18,200 | $88,300 |
| 2023 | $1,942 | $106,500 | $18,200 | $88,300 |
| 2022 | $1,926 | $91,300 | $15,900 | $75,400 |
| 2021 | $1,792 | $91,300 | $15,900 | $75,400 |
| 2020 | $1,856 | $80,400 | $13,900 | $66,500 |
| 2019 | $1,704 | $80,400 | $13,900 | $66,500 |
| 2018 | $1,548 | $71,900 | $12,000 | $59,900 |
| 2017 | $1,798 | $66,900 | $12,000 | $54,900 |
| 2016 | $1,752 | $66,500 | $11,800 | $54,700 |
| 2015 | $1,752 | $66,500 | $11,800 | $54,700 |
| 2014 | $880 | $33,100 | $13,100 | $20,000 |
Source: Public Records
Map
Nearby Homes
- 2807 1st St
- 2826 Oxford St
- 2925 2nd Ave
- 2701 Cornell St
- 3012 Cornell St
- 3007 Cornell St
- 3118 1st St
- 2818 Bowdoin St
- 414 E Sheridan Ave
- 3200 Oxford St
- 3019 Columbia St
- 3107 5th Ave
- 222 Watson Ave
- 3220 Cornell St
- 3308 Cambridge St
- 3208 Bowdoin St
- 3131 6th Ave
- 3413 2nd Ave
- 2305 Saylor Rd
- 703 Arthur Ave