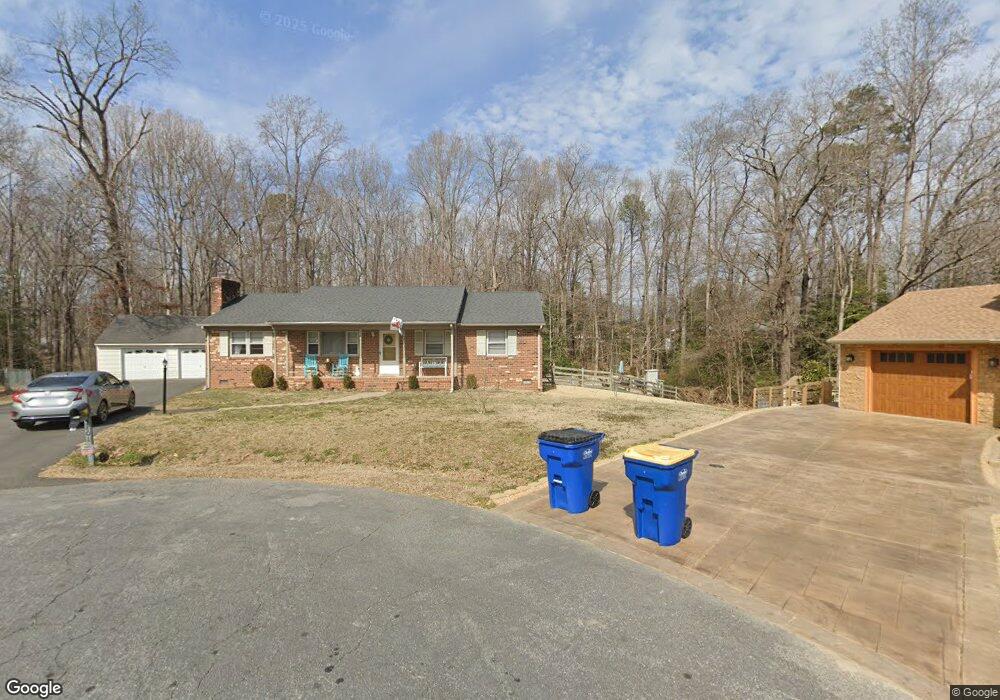
2801 Delfin Rd Midlothian, VA 23112
Estimated Value: $317,000 - $358,624
3
Beds
2
Baths
1,431
Sq Ft
$236/Sq Ft
Est. Value
About This Home
This home is located at 2801 Delfin Rd, Midlothian, VA 23112 and is currently estimated at $337,656, approximately $235 per square foot. 2801 Delfin Rd is a home located in Chesterfield County with nearby schools including Evergreen Elementary, Swift Creek Middle, and Clover Hill High.
Ownership History
Date
Name
Owned For
Owner Type
Purchase Details
Closed on
Mar 9, 2021
Sold by
Morgan Albert W and Morgan Rebekah T
Bought by
Miles Jodi Lyn
Current Estimated Value
Home Financials for this Owner
Home Financials are based on the most recent Mortgage that was taken out on this home.
Original Mortgage
$202,400
Outstanding Balance
$181,437
Interest Rate
2.7%
Mortgage Type
New Conventional
Estimated Equity
$156,219
Purchase Details
Closed on
Dec 8, 2020
Sold by
Ingram Leslie
Bought by
Morgan Albert W and Morgan Rebekah T
Purchase Details
Closed on
Oct 30, 2002
Sold by
Haynie Jason T
Bought by
Ingram Leslie
Purchase Details
Closed on
Jan 10, 2002
Sold by
Haynie Jason T
Bought by
Haynie Jason T and Haynie Marcella D
Purchase Details
Closed on
Dec 1, 1997
Bought by
Haynes Jason T
Home Financials for this Owner
Home Financials are based on the most recent Mortgage that was taken out on this home.
Original Mortgage
$92,818
Interest Rate
7.26%
Mortgage Type
FHA
Purchase Details
Closed on
Nov 27, 1996
Sold by
Davis Joan D
Bought by
Gilliam Franklin W
Create a Home Valuation Report for This Property
The Home Valuation Report is an in-depth analysis detailing your home's value as well as a comparison with similar homes in the area
Home Values in the Area
Average Home Value in this Area
Purchase History
| Date | Buyer | Sale Price | Title Company |
|---|---|---|---|
| Miles Jodi Lyn | $253,000 | Attorney | |
| Morgan Albert W | $180,000 | Attorney | |
| Ingram Leslie | $138,660 | -- | |
| Haynie Jason T | -- | -- | |
| Haynes Jason T | $93,000 | -- | |
| Gilliam Franklin W | $17,000 | -- |
Source: Public Records
Mortgage History
| Date | Status | Borrower | Loan Amount |
|---|---|---|---|
| Open | Miles Jodi Lyn | $202,400 | |
| Previous Owner | Gilliam Franklin W | $92,818 |
Source: Public Records
Tax History Compared to Growth
Tax History
| Year | Tax Paid | Tax Assessment Tax Assessment Total Assessment is a certain percentage of the fair market value that is determined by local assessors to be the total taxable value of land and additions on the property. | Land | Improvement |
|---|---|---|---|---|
| 2025 | $2,736 | $304,600 | $60,000 | $244,600 |
| 2024 | $2,736 | $296,300 | $58,000 | $238,300 |
| 2023 | $2,603 | $286,000 | $55,000 | $231,000 |
| 2022 | $2,461 | $267,500 | $49,000 | $218,500 |
| 2021 | $2,327 | $242,300 | $46,000 | $196,300 |
| 2020 | $2,162 | $227,600 | $46,000 | $181,600 |
| 2019 | $2,005 | $211,000 | $44,000 | $167,000 |
| 2018 | $1,905 | $201,600 | $42,000 | $159,600 |
| 2017 | $1,869 | $192,100 | $42,000 | $150,100 |
| 2016 | $1,671 | $174,100 | $42,000 | $132,100 |
| 2015 | $1,626 | $169,400 | $42,000 | $127,400 |
| 2014 | $1,581 | $164,700 | $42,000 | $122,700 |
Source: Public Records
Map
Nearby Homes
- 3128 Woodsong Dr
- 3350 Kellynn Dr
- 10901 Sunset Hills Dr
- 2307 Krossridge Ct
- 2718 Colgrave Rd
- 3113 Gregwood Rd
- 2218 Providence Creek Rd
- 2300 Krossridge Ct
- 11000 Hull Street Rd
- 15913 MacLear Dr
- 16019 MacLear Dr
- 2915 S Ridge Dr
- 12307 Duck River Rd
- 12403 Beaver Falls Ct
- 3631 Clintwood Rd
- 10618 W Providence Rd
- 11130 Poachers Run
- 10927 Decoy Ln
- Drexel Plan at Falling Creek - The Estates at Falling Creek
- Brevard Plan at Falling Creek - The Estates at Falling Creek