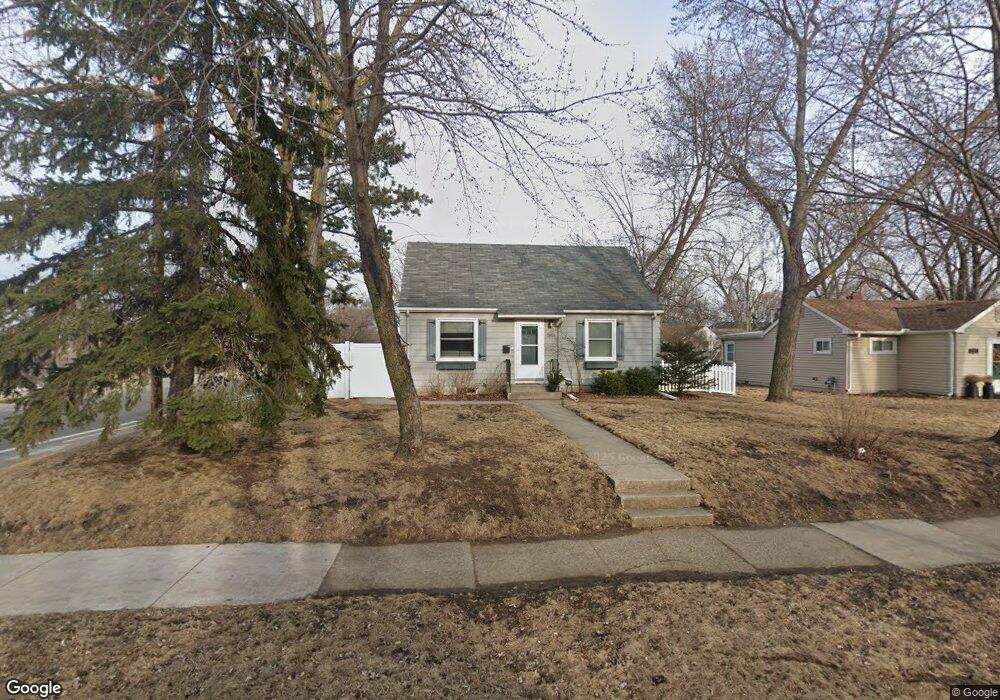
2801 Pennsylvania Ave S Saint Louis Park, MN 55426
Texa-Tonka NeighborhoodEstimated Value: $421,000 - $482,000
4
Beds
2
Baths
1,215
Sq Ft
$371/Sq Ft
Est. Value
About This Home
This home is located at 2801 Pennsylvania Ave S, Saint Louis Park, MN 55426 and is currently estimated at $450,587, approximately $370 per square foot. 2801 Pennsylvania Ave S is a home located in Hennepin County with nearby schools including Peter Hobart Elementary School, St. Louis Park Middle School, and St. Louis Park High School.
Ownership History
Date
Name
Owned For
Owner Type
Purchase Details
Closed on
Jul 27, 2016
Sold by
Stoll Casey M
Bought by
Davidson Jane E
Current Estimated Value
Home Financials for this Owner
Home Financials are based on the most recent Mortgage that was taken out on this home.
Original Mortgage
$293,250
Outstanding Balance
$233,979
Interest Rate
3.48%
Mortgage Type
New Conventional
Estimated Equity
$216,608
Purchase Details
Closed on
Apr 30, 2014
Sold by
Oakwood Partners Llc
Bought by
Stoll Casey M and Stoll Sherry R
Home Financials for this Owner
Home Financials are based on the most recent Mortgage that was taken out on this home.
Original Mortgage
$259,200
Interest Rate
4.41%
Mortgage Type
New Conventional
Purchase Details
Closed on
Aug 26, 2013
Sold by
Grove Terry A
Bought by
Oakwood Partners Llc
Purchase Details
Closed on
May 20, 2004
Sold by
Grove Henry R and Grove Loretta S
Bought by
Grove Henry R and Grove Revocable Intervivos Trust
Create a Home Valuation Report for This Property
The Home Valuation Report is an in-depth analysis detailing your home's value as well as a comparison with similar homes in the area
Home Values in the Area
Average Home Value in this Area
Purchase History
| Date | Buyer | Sale Price | Title Company |
|---|---|---|---|
| Davidson Jane E | $345,000 | Burnet Title | |
| Stoll Casey M | $324,000 | Burnet Title | |
| Oakwood Partners Llc | $137,000 | None Available | |
| Grove Henry R | -- | None Available |
Source: Public Records
Mortgage History
| Date | Status | Borrower | Loan Amount |
|---|---|---|---|
| Open | Davidson Jane E | $293,250 | |
| Previous Owner | Stoll Casey M | $259,200 |
Source: Public Records
Tax History Compared to Growth
Tax History
| Year | Tax Paid | Tax Assessment Tax Assessment Total Assessment is a certain percentage of the fair market value that is determined by local assessors to be the total taxable value of land and additions on the property. | Land | Improvement |
|---|---|---|---|---|
| 2024 | $5,841 | $423,800 | $157,900 | $265,900 |
| 2023 | $5,834 | $437,800 | $157,900 | $279,900 |
| 2022 | $4,783 | $441,900 | $150,400 | $291,500 |
| 2021 | $4,648 | $361,300 | $130,800 | $230,500 |
| 2020 | $4,845 | $355,100 | $124,600 | $230,500 |
| 2019 | $5,049 | $355,100 | $118,700 | $236,400 |
| 2018 | $4,967 | $356,800 | $113,100 | $243,700 |
| 2017 | $4,229 | $302,600 | $89,500 | $213,100 |
| 2016 | $4,224 | $292,300 | $80,800 | $211,500 |
| 2015 | $2,002 | $150,200 | $75,600 | $74,600 |
| 2014 | -- | $154,400 | $71,800 | $82,600 |
Source: Public Records
Map
Nearby Homes
- 2575 Quebec Ave S
- 2841 Texas Ave S
- 7914 Victoria Curve
- 2819 Virginia Ave S
- 7217 Minnetonka Blvd
- 7907 W 25th St
- 8000 W 26th St
- 2620 Kentucky Ave S
- 2608 Kentucky Ave S
- 3101 Nevada Ave S
- 2849 Jersey Ave S
- 2732 Idaho Ave S
- 3101 Sumter Ave S
- 3124 Maryland Ave S
- 2622 Idaho Ave S
- 3149 Nevada Ave S
- 2852 Hampshire Ave S
- 8016 Cedar Lake Rd S
- 3153 Nevada Ave S
- 2910 Wyoming Ave S
- 2801 Pennsylvania Ave S
- 2805 Pennsylvania Ave S
- 2804 2804 Pennsylvania Ave S
- 2809 Pennsylvania Ave S
- 2800 Oregon Ave S
- 2804 Oregon Ave S
- 2813 Pennsylvania Ave S
- 2808 Oregon Ave S
- 2800 Pennsylvania Ave S
- 2804 Pennsylvania Ave S
- 2810 Pennsylvania Ave S
- 2812 Oregon Ave S
- 2814 Pennsylvania Ave S
- 2817 Pennsylvania Ave S
- 2820 Pennsylvania Ave S
- 2816 Oregon Ave S
- 2813 2813 Oregon-Avenue-s
- 2821 Pennsylvania Ave S
- 2812 2812 Oregon Ave S
- 2824 Pennsylvania Ave S