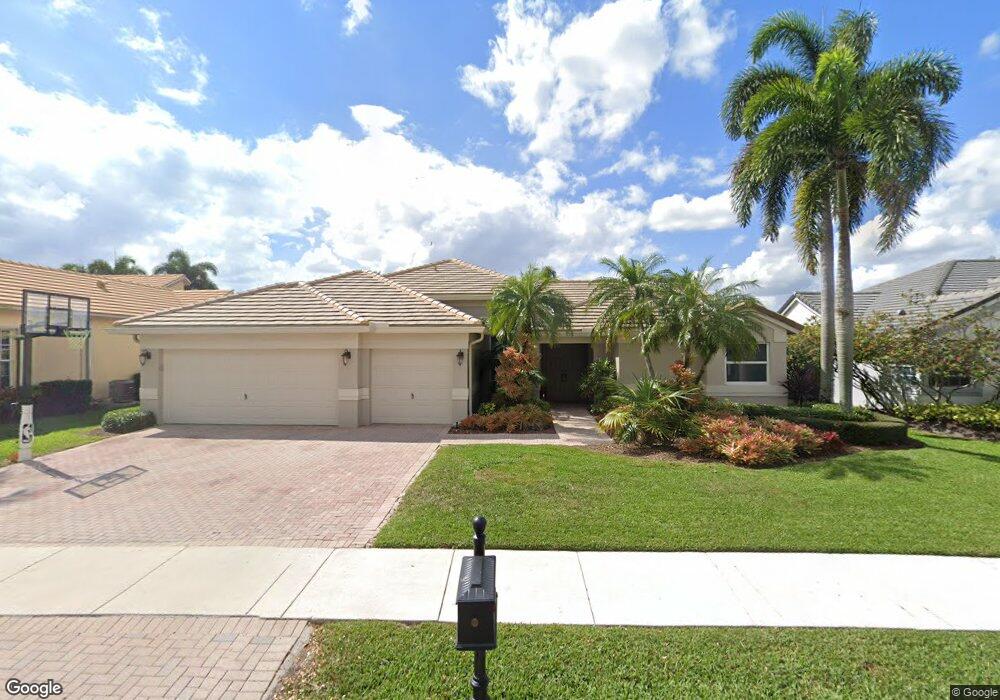
2801 W Abiaca Cir Davie, FL 33328
Forest Ridge NeighborhoodEstimated Value: $854,199 - $1,117,000
4
Beds
3
Baths
2,518
Sq Ft
$395/Sq Ft
Est. Value
About This Home
This home is located at 2801 W Abiaca Cir, Davie, FL 33328 and is currently estimated at $994,550, approximately $394 per square foot. 2801 W Abiaca Cir is a home located in Broward County with nearby schools including Fox Trail Elementary School, Indian Ridge Middle School, and Western High School.
Ownership History
Date
Name
Owned For
Owner Type
Purchase Details
Closed on
Sep 13, 2011
Sold by
Seldal Alan and Seldal Cheri
Bought by
Seldal Alan and Seldal Cheri
Current Estimated Value
Purchase Details
Closed on
Aug 24, 2009
Sold by
Mcgloin William and Santore Mario
Bought by
Seidal Alan and Horowitz Cheri
Home Financials for this Owner
Home Financials are based on the most recent Mortgage that was taken out on this home.
Original Mortgage
$336,000
Outstanding Balance
$218,402
Interest Rate
5.15%
Mortgage Type
New Conventional
Estimated Equity
$776,148
Purchase Details
Closed on
Nov 22, 2000
Sold by
Hopen Richard M and Hopen Joanne W
Bought by
Mcgloin William and Santore Marlo
Purchase Details
Closed on
Jul 22, 1998
Sold by
Forest Ridge Community Development Ltd
Bought by
Hopen Richard M and Hopen Joanne W
Create a Home Valuation Report for This Property
The Home Valuation Report is an in-depth analysis detailing your home's value as well as a comparison with similar homes in the area
Home Values in the Area
Average Home Value in this Area
Purchase History
| Date | Buyer | Sale Price | Title Company |
|---|---|---|---|
| Seldal Alan | -- | Attorney | |
| Seidal Alan | $420,000 | Jm Title Services Inc | |
| Mcgloin William | $274,000 | -- | |
| Hopen Richard M | $222,200 | -- |
Source: Public Records
Mortgage History
| Date | Status | Borrower | Loan Amount |
|---|---|---|---|
| Open | Seidal Alan | $336,000 |
Source: Public Records
Tax History Compared to Growth
Tax History
| Year | Tax Paid | Tax Assessment Tax Assessment Total Assessment is a certain percentage of the fair market value that is determined by local assessors to be the total taxable value of land and additions on the property. | Land | Improvement |
|---|---|---|---|---|
| 2025 | $7,094 | $371,790 | -- | -- |
| 2024 | $6,946 | $361,320 | -- | -- |
| 2023 | $6,946 | $350,800 | $0 | $0 |
| 2022 | $6,504 | $340,590 | $0 | $0 |
| 2021 | $6,300 | $330,670 | $0 | $0 |
| 2020 | $6,252 | $326,110 | $0 | $0 |
| 2019 | $6,056 | $318,780 | $0 | $0 |
| 2018 | $5,865 | $312,840 | $0 | $0 |
| 2017 | $5,497 | $293,340 | $0 | $0 |
| 2016 | $5,451 | $287,310 | $0 | $0 |
| 2015 | $5,573 | $285,320 | $0 | $0 |
| 2014 | $5,632 | $283,060 | $0 | $0 |
| 2013 | -- | $314,570 | $76,930 | $237,640 |
Source: Public Records
Map
Nearby Homes
- 2864 E Abiaca Cir
- 10303 SW 26th St
- 9358 Arborwood Cir
- 10372 N Lake Vista Cir
- 2793 Oakleigh Ln
- 9530 Alcazar Ln
- 2747 Pinewood Ct
- 10345 SW 23rd Ct
- 2675 Arborwood Rd
- 2655 Arborwood Rd
- 2702 Arborwood Rd
- 9460 Live Oak Place Unit 309
- 9450 Live Oak Place Unit 109
- 9520 Seagrape Dr Unit 306
- 9531 Seagrape Dr Unit 304
- 9531 Seagrape Dr Unit 205
- 9440 Live Oak Place Unit 307
- 9220 Arborwood Cir
- 9431 Live Oak Place Unit 203
- 1931 Sabal Palm Dr Unit 301
- 2781 W Abiaca Cir
- 2821 W Abiaca Cir
- 2761 W Abiaca Cir
- 2841 W Abiaca Cir
- 2802 W Abiaca Cir
- 2822 W Abiaca Cir
- 2782 W Abiaca Cir
- 2842 W Abiaca Cir
- 2741 W Abiaca Cir
- 2861 W Abiaca Cir
- 2762 W Abiaca Cir
- 2862 W Abiaca Cir
- 2803 E Abiaca Cir
- 2823 E Abiaca Cir
- 2783 E Abiaca Cir
- 2742 W Abiaca Cir
- 2881 W Abiaca Cir
- 2721 W Abiaca Cir
- 2843 E Abiaca Cir
- 2763 E Abiaca Cir