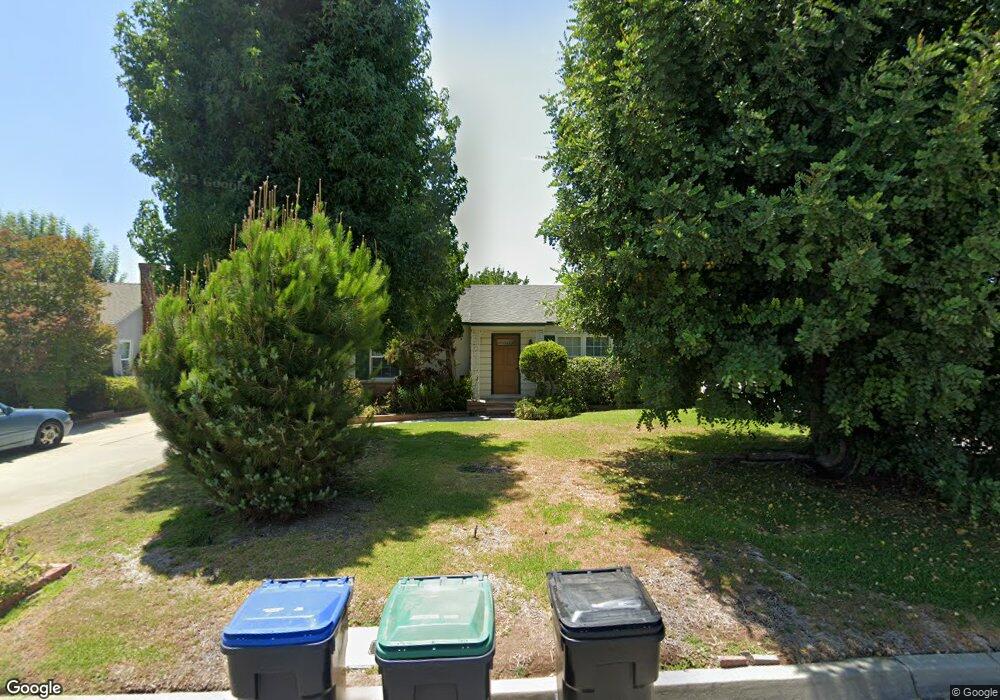
2801 Winthrop Ave Arcadia, CA 91007
Estimated Value: $1,286,000 - $1,618,000
About This Home
This home is located at 2801 Winthrop Ave, Arcadia, CA 91007 and is currently estimated at $1,484,919, approximately $870 per square foot. 2801 Winthrop Ave is a home located in Los Angeles County with nearby schools including Longley Way Elementary School, Richard Henry Dana Middle School, and Arcadia High School.
Ownership History
We collect this data history from publicly available records. To have your information removed, we recommend requesting removal directly through your county’s website.
Purchase Details
Purchase Details
Home Financials for this Owner
Home Financials are based on the most recent Mortgage that was taken out on this home.Purchase Details
Home Financials for this Owner
Home Financials are based on the most recent Mortgage that was taken out on this home.Purchase Details
Home Values in the Area
Average Home Value in this Area
Purchase History
We collect this data history from publicly available records. To have your information removed, we recommend requesting removal directly through your county’s website.
| Date | Buyer | Sale Price | Title Company |
|---|---|---|---|
| -- | -- | ||
| -- | Southland Title Corporation | ||
| $342,500 | Southland Title | ||
| -- | -- |
Mortgage History
We collect this data history from publicly available records. To have your information removed, we recommend requesting removal directly through your county’s website.
| Date | Status | Borrower | Loan Amount |
|---|---|---|---|
| Open | $240,000 |
Tax History
We collect this data history from publicly available records. To have your information removed, we recommend requesting removal directly through your county’s website.
| Year | Tax Paid | Tax Assessment Tax Assessment Total Assessment is a certain percentage of the fair market value that is determined by local assessors to be the total taxable value of land and additions on the property. | Land | Improvement |
|---|---|---|---|---|
| 2025 | $6,668 | $526,394 | $374,091 | $152,303 |
| 2024 | $6,279 | $516,073 | $366,756 | $149,317 |
| 2023 | $6,151 | $505,955 | $359,565 | $146,390 |
| 2022 | $5,958 | $496,035 | $352,515 | $143,520 |
| 2021 | $5,847 | $486,309 | $345,603 | $140,706 |
| 2019 | $5,711 | $471,887 | $335,353 | $136,534 |
| 2018 | $5,511 | $462,635 | $328,778 | $133,857 |
| 2016 | $5,342 | $444,672 | $316,012 | $128,660 |
| 2015 | $5,250 | $437,994 | $311,266 | $126,728 |
| 2014 | $5,185 | $429,415 | $305,169 | $124,246 |
Map
- 481 W Live Oak Ave
- 501 W Woodruff Ave
- 356 W Palm Dr
- 10240 Nadine St
- 2409 Albert Way
- 466 Walnut Ave
- 5554 Pal Mal Ave
- 9959 Garibaldi Ave
- 5550 El Monte Ave
- 5307 Baldwin Ave
- 10660 Daines Dr
- 9686 Live Oak Ave
- 5703 Kauffman Ave
- 9821 Garibaldi Ave
- 300 W Longden Ave
- 5602 Persimmon Ave
- 5155 Arden Dr
- 185 W Palm Dr
- 339 W Longden Ave
- 2027 Holly Ave
- 2807 Winthrop Ave
- 2733 Winthrop Ave
- 2811 Winthrop Ave
- 2729 Winthrop Ave
- 2802 Bradford Ave
- 2817 Winthrop Ave
- 2723 Winthrop Ave
- 2824 Winthrop Ave
- 2806 Bradford Ave
- 2732 Bradford Ave
- 2810 Bradford Ave
- 2728 Bradford Ave
- 2800 Winthrop Ave
- 2821 Winthrop Ave
- 2719 Winthrop Ave
- 2808 Winthrop Ave
- 2734 Winthrop Ave
- 2816 Bradford Ave
- 2722 Bradford Ave
- 2812 Winthrop Ave
Ask me questions while you tour the home.