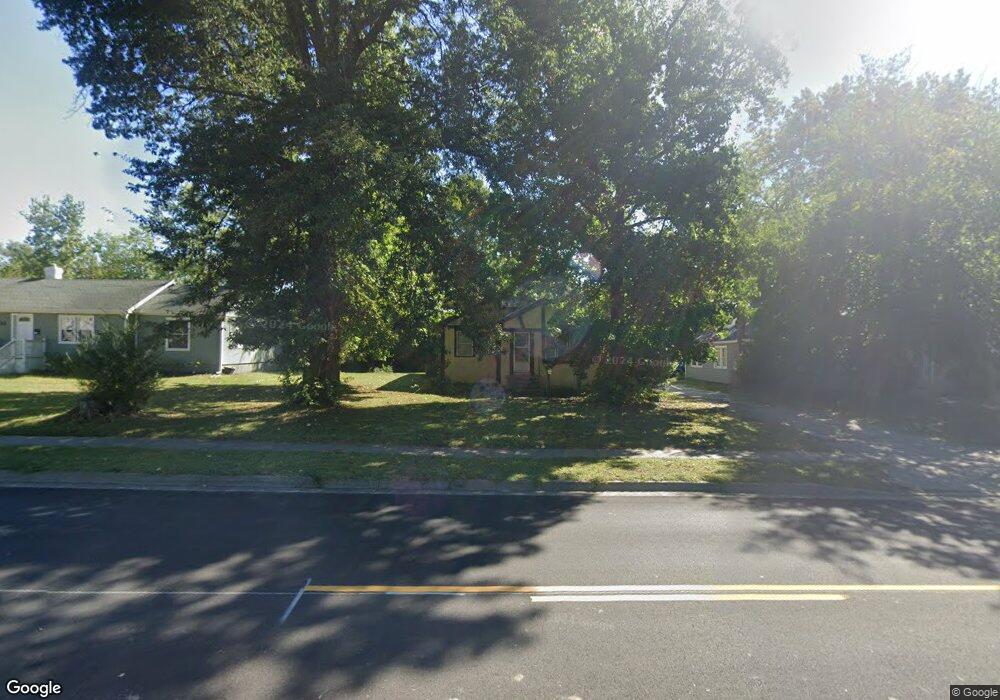
2805 S Crysler Ave Independence, MO 64052
Three Trails NeighborhoodEstimated Value: $184,000 - $199,000
3
Beds
1
Bath
1,159
Sq Ft
$164/Sq Ft
Est. Value
About This Home
This home is located at 2805 S Crysler Ave, Independence, MO 64052 and is currently estimated at $190,445, approximately $164 per square foot. 2805 S Crysler Ave is a home located in Jackson County with nearby schools including Santa Fe Trail Elementary School, Bridger Middle School, and Pioneer Ridge Middle School.
Ownership History
Date
Name
Owned For
Owner Type
Purchase Details
Closed on
Feb 24, 2009
Sold by
Dickey Jennifer Elaine
Bought by
Ford Christopher D
Current Estimated Value
Purchase Details
Closed on
Jul 23, 1996
Sold by
Flahive Pat J and Flahive Barbara J
Bought by
Flahive John P
Purchase Details
Closed on
May 16, 1996
Sold by
Hook Shirley
Bought by
Flahive Barbara J
Create a Home Valuation Report for This Property
The Home Valuation Report is an in-depth analysis detailing your home's value as well as a comparison with similar homes in the area
Home Values in the Area
Average Home Value in this Area
Purchase History
| Date | Buyer | Sale Price | Title Company |
|---|---|---|---|
| Ford Christopher D | -- | Chicago | |
| Flahive John P | -- | -- | |
| Flahive Pat J | -- | -- | |
| Flahive Barbara J | -- | -- |
Source: Public Records
Tax History Compared to Growth
Tax History
| Year | Tax Paid | Tax Assessment Tax Assessment Total Assessment is a certain percentage of the fair market value that is determined by local assessors to be the total taxable value of land and additions on the property. | Land | Improvement |
|---|---|---|---|---|
| 2025 | $2,143 | $31,660 | $5,001 | $26,659 |
| 2024 | $2,095 | $30,936 | $5,818 | $25,118 |
| 2023 | $2,095 | $30,936 | $3,439 | $27,497 |
| 2022 | $1,768 | $23,940 | $4,701 | $19,239 |
| 2021 | $1,768 | $23,940 | $4,701 | $19,239 |
| 2020 | $1,593 | $20,965 | $4,701 | $16,264 |
| 2019 | $1,568 | $20,965 | $4,701 | $16,264 |
| 2018 | $1,429 | $18,246 | $4,091 | $14,155 |
| 2017 | $1,407 | $18,246 | $4,091 | $14,155 |
| 2016 | $1,407 | $17,789 | $3,327 | $14,462 |
| 2014 | $1,337 | $17,271 | $3,230 | $14,041 |
Source: Public Records
Map
Nearby Homes
- 1305 W 29th St S
- 2805 S Fuller Ave
- 1319 W 29th St S
- 1323 W 29th St S
- 2741 Windsor Ave
- 1325 W 29th St S
- 1130 W 27th St S
- 1222 W 26th St S
- 1220 W 26th St S
- 818 W 30th St
- 1218 W 25th Terrace S
- 3210 S Crysler Ave
- 3216 S Crysler Ave
- 3210 S Santa fe Rd
- 832 W Charles St
- 1226 Windsor St
- 12108 Markham Rd
- 2521 & 2525 Race Ave
- 1224 Windsor St
- 3112 S Claremont Ave
- 2807 S Crysler Ave
- 2803 S Crysler Ave
- 2809 S Crysler Ave
- 2806 S Crysler Ave
- 1300 W 29th St S
- 2811 S Crysler Ave
- 1305 W Scott Place
- 2736 S Crysler Ave
- 1302 W 29th St S
- 2901 S Crysler Ave
- 1307 W Scott Place
- 1301 W 29th St S
- 1304 W 29th St S
- 2732 S Crysler Ave
- 1308 W Scott Place
- 1407 W Scott Place
- 2739 S Crysler Ave
- 2815 S Fuller Ave
- 2903 S Crysler Ave
- 1303 W 29th St S