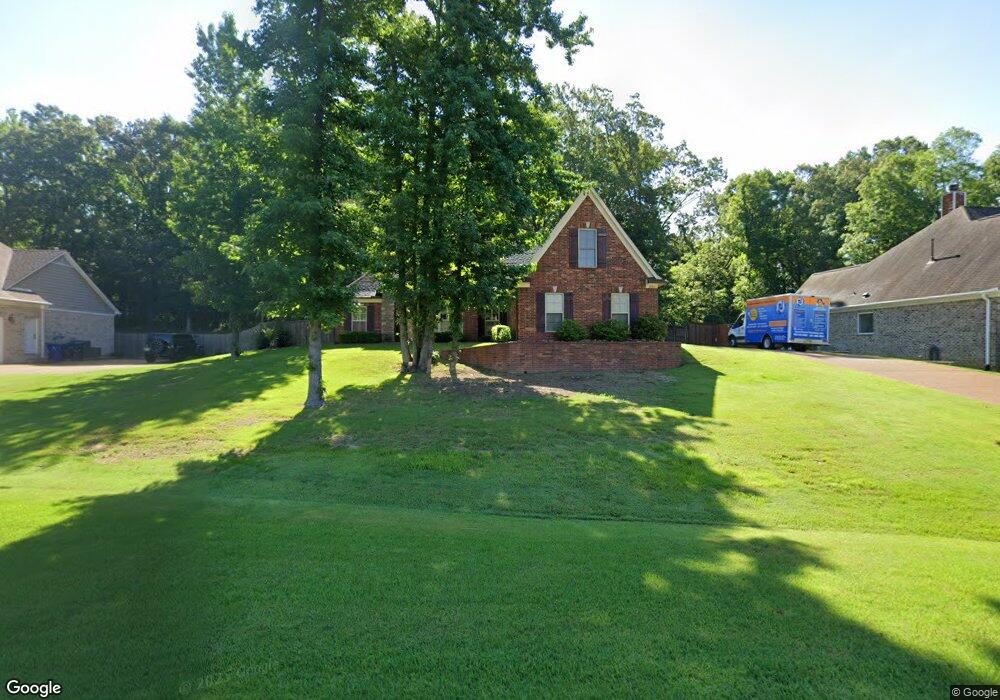
2806 Blackrock Dr Nesbit, MS 38651
Pleasant Hill NeighborhoodEstimated Value: $353,000 - $362,000
4
Beds
--
Bath
2,691
Sq Ft
$133/Sq Ft
Est. Value
About This Home
This home is located at 2806 Blackrock Dr, Nesbit, MS 38651 and is currently estimated at $357,519, approximately $132 per square foot. 2806 Blackrock Dr is a home with nearby schools including DeSoto Central Primary School, DeSoto Central Elementary School, and DeSoto Central Middle School.
Ownership History
Date
Name
Owned For
Owner Type
Purchase Details
Closed on
Oct 28, 2025
Sold by
Baskin Margaret
Bought by
Cox Daniel and Cox Dianne
Current Estimated Value
Home Financials for this Owner
Home Financials are based on the most recent Mortgage that was taken out on this home.
Original Mortgage
$361,550
Outstanding Balance
$361,550
Interest Rate
4%
Mortgage Type
VA
Estimated Equity
-$4,031
Purchase Details
Closed on
May 7, 2016
Sold by
Baskin William and Baskin Margaret
Bought by
Baskin Margaret
Purchase Details
Closed on
Oct 21, 2011
Sold by
Wheeler Homes Llc
Bought by
Baskin William L and Baskin Margaret A
Home Financials for this Owner
Home Financials are based on the most recent Mortgage that was taken out on this home.
Original Mortgage
$209,593
Interest Rate
4.2%
Mortgage Type
FHA
Create a Home Valuation Report for This Property
The Home Valuation Report is an in-depth analysis detailing your home's value as well as a comparison with similar homes in the area
Home Values in the Area
Average Home Value in this Area
Purchase History
| Date | Buyer | Sale Price | Title Company |
|---|---|---|---|
| Cox Daniel | -- | Magnolia Title | |
| Baskin Margaret | -- | None Available | |
| Baskin William L | -- | None Available |
Source: Public Records
Mortgage History
| Date | Status | Borrower | Loan Amount |
|---|---|---|---|
| Open | Cox Daniel | $361,550 | |
| Previous Owner | Baskin William L | $209,593 |
Source: Public Records
Tax History
| Year | Tax Paid | Tax Assessment Tax Assessment Total Assessment is a certain percentage of the fair market value that is determined by local assessors to be the total taxable value of land and additions on the property. | Land | Improvement |
|---|---|---|---|---|
| 2025 | $1,376 | $18,855 | $3,200 | $15,655 |
| 2024 | $1,644 | $18,855 | $3,200 | $15,655 |
| 2023 | $1,644 | $18,855 | $0 | $0 |
| 2022 | $2,372 | $18,855 | $3,200 | $15,655 |
| 2021 | $2,372 | $18,855 | $3,200 | $15,655 |
| 2020 | $2,192 | $17,587 | $3,200 | $14,387 |
| 2019 | $2,192 | $17,587 | $3,200 | $14,387 |
| 2017 | $2,224 | $32,246 | $17,723 | $14,523 |
| 2016 | $2,224 | $17,723 | $3,200 | $14,523 |
| 2015 | $2,524 | $32,246 | $17,723 | $14,523 |
| 2014 | $2,224 | $17,723 | $0 | $0 |
| 2013 | $684 | $17,723 | $0 | $0 |
Source: Public Records
Map
Nearby Homes
- 2768 Black Rock Rd
- 1777 Starlanding Rd E
- 1623 Imboden Cove
- 002 Baptist Rd
- 3458 Marcia Louise Dr
- 2154 Laughter Rd N
- 3520 Lindsey Ln
- 939 Buttermilk Dr
- Plan 2030 at Cherry Tree Park South
- Plan 1700 at Cherry Tree Park South
- Plan 2265 at Cherry Tree Park South
- Plan 1717 at Cherry Tree Park South
- Plan 1665 at Cherry Tree Park South
- Plan 2200 at Cherry Tree Park South
- Plan 2300 at Cherry Tree Park South
- Plan 1930 at Cherry Tree Park South
- Plan 2020 at Cherry Tree Park South
- Plan 1820-2 at Cherry Tree Park South
- Plan 2029 at Cherry Tree Park South
- The 1635-C Plan at Cherry Tree Park South
- 2784 Blackrock Dr
- 2828 Blackrock Dr
- 1686 Rutherford Cove
- 2854 Blackrock Dr
- 1687 Imboden Cove
- 1664 Rutherford Cove
- 1686 Rutherford Cove
- 1825 Star Landing Rd
- 2876 Blackrock Dr
- 1669 Imboden Cove
- 11 Black Rock Rd
- 10 Black Rock Rd
- 1646 Rutherford Cove
- 1647 Imboden Cove
- 1688 Imboden Cove
- 1623 Imboden Cove
- 1647 Rutherford Cove
- 2702 Baptist Rd
- 1670 Imboden Cove
- 2106 Great Barrington Place
Your Personal Tour Guide
Ask me questions while you tour the home.