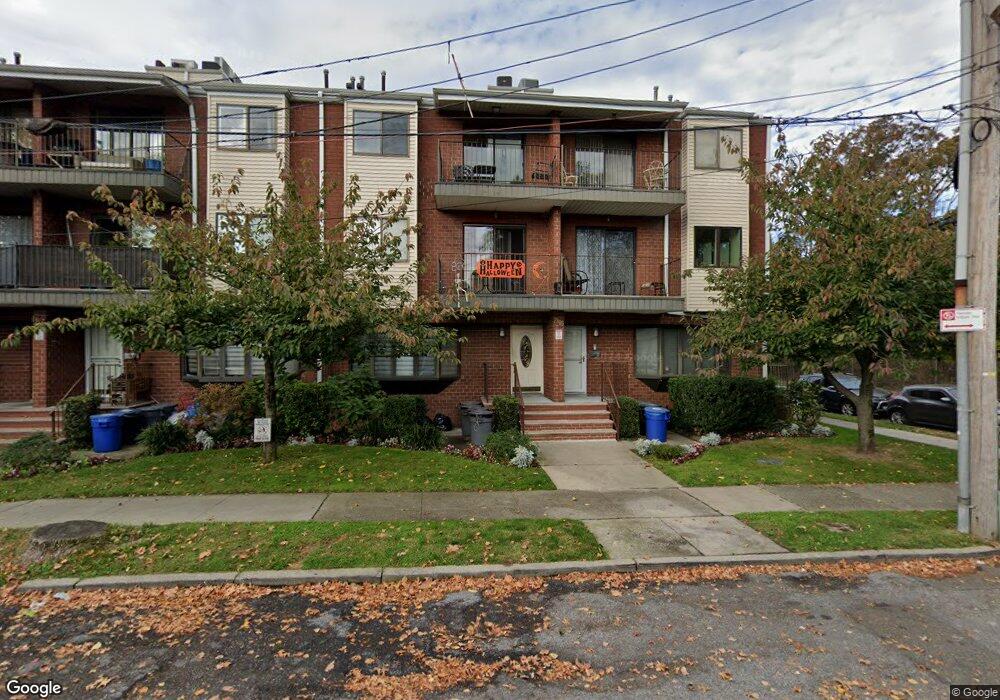
2806 E 27th St Unit 2830 Brooklyn, NY 11235
Sheepshead Bay NeighborhoodEstimated Value: $333,000 - $789,000
--
Bed
--
Bath
561
Sq Ft
$901/Sq Ft
Est. Value
About This Home
This home is located at 2806 E 27th St Unit 2830, Brooklyn, NY 11235 and is currently estimated at $505,699, approximately $901 per square foot. 2806 E 27th St Unit 2830 is a home located in Kings County with nearby schools including P.S. 52 Sheepshead Bay, Jhs 14 Shell Bank, and St Mark School.
Ownership History
Date
Name
Owned For
Owner Type
Purchase Details
Closed on
May 13, 2010
Sold by
Rappa Eduard
Bought by
Volkin Mikhail
Current Estimated Value
Home Financials for this Owner
Home Financials are based on the most recent Mortgage that was taken out on this home.
Original Mortgage
$224,000
Outstanding Balance
$151,456
Interest Rate
5.23%
Mortgage Type
Purchase Money Mortgage
Estimated Equity
$354,243
Purchase Details
Closed on
Apr 1, 2003
Sold by
Lyubeznik Yuriy
Bought by
Rappa Eduard
Home Financials for this Owner
Home Financials are based on the most recent Mortgage that was taken out on this home.
Original Mortgage
$228,800
Interest Rate
6.15%
Mortgage Type
Purchase Money Mortgage
Purchase Details
Closed on
Dec 31, 2001
Sold by
Farella John S
Bought by
Lyubeznik Yuriy
Home Financials for this Owner
Home Financials are based on the most recent Mortgage that was taken out on this home.
Original Mortgage
$132,000
Interest Rate
6.85%
Mortgage Type
Purchase Money Mortgage
Create a Home Valuation Report for This Property
The Home Valuation Report is an in-depth analysis detailing your home's value as well as a comparison with similar homes in the area
Home Values in the Area
Average Home Value in this Area
Purchase History
| Date | Buyer | Sale Price | Title Company |
|---|---|---|---|
| Volkin Mikhail | $280,000 | -- | |
| Volkin Mikhail | $280,000 | -- | |
| Rappa Eduard | $260,000 | -- | |
| Rappa Eduard | $260,000 | -- | |
| Lyubeznik Yuriy | -- | -- | |
| Lyubeznik Yuriy | -- | -- |
Source: Public Records
Mortgage History
| Date | Status | Borrower | Loan Amount |
|---|---|---|---|
| Open | Volkin Mikhail | $224,000 | |
| Closed | Volkin Mikhail | $224,000 | |
| Previous Owner | Rappa Eduard | $228,800 | |
| Previous Owner | Lyubeznik Yuriy | $132,000 |
Source: Public Records
Tax History Compared to Growth
Tax History
| Year | Tax Paid | Tax Assessment Tax Assessment Total Assessment is a certain percentage of the fair market value that is determined by local assessors to be the total taxable value of land and additions on the property. | Land | Improvement |
|---|---|---|---|---|
| 2025 | $3,612 | $28,859 | $2,033 | $26,826 |
| 2024 | $3,612 | $25,433 | $2,033 | $23,400 |
| 2023 | $3,504 | $22,436 | $2,033 | $20,403 |
| 2022 | $3,264 | $20,657 | $2,033 | $18,624 |
| 2021 | $3,247 | $20,239 | $2,033 | $18,206 |
| 2020 | $1,568 | $23,454 | $2,033 | $21,421 |
| 2019 | $3,135 | $24,707 | $2,033 | $22,674 |
| 2018 | $2,931 | $14,379 | $1,282 | $13,097 |
| 2017 | $2,777 | $13,625 | $1,313 | $12,312 |
| 2016 | $2,570 | $12,856 | $1,668 | $11,188 |
| 2015 | $1,548 | $12,448 | $1,620 | $10,828 |
| 2014 | $1,548 | $15,713 | $2,000 | $13,713 |
Source: Public Records
Map
Nearby Homes
- 2613 Emmons Ave Unit 3D
- 2809 E 28th St Unit 1C
- 3611 Shore Pkwy Unit 1C
- 2752 E 27th St Unit A3
- 4817 Bedford Ave Unit 3A
- 2800 E 29th St Unit 103
- 2758 E 26th St
- 2900 E 29th St Unit 2E
- 2726 E 27th St
- 4812 Bedford Ave Unit 1A
- 3678 Shore Pkwy
- 3655 Shore Pkwy Unit 2J
- 2711 E 26th St
- 4050 Nostrand Ave Unit 1F
- 2614 Voorhies Ave
- 4078 Nostrand Ave Unit 1B
- 3541 Shore Pkwy Unit B2
- 2703 E 28th St
- 4715 Bedford Ave
- 4709 Bedford Ave
- 2806 E 27th St Unit 2830
- 2806 E 27th St Unit 2830
- 2806 E 27th St Unit 2830
- 2806 E 27th St Unit 2830
- 2806 E 27th St Unit 2830
- 2806 E 27th St Unit 2830
- 2806 E 27th St Unit 2830
- 2806 E 27th St Unit 2830
- 2806 E 27th St Unit 2830
- 2806 E 27th St Unit 2830
- 2806 E 27th St Unit 2830
- 2806 E 27th St Unit 2830
- 2806 E 27th St Unit 2830
- 2806 E 27th St Unit 2830
- 2806 E 27th St Unit 2830
- 2806 E 27th St Unit 2830
- 2806 E 27th St Unit 2830
- 2806 E 27th St Unit 2830
- 2806 E 27th St Unit 2830
- 2806 E 27th St Unit 2830