Estimated Value: $370,000 - $499,384
3
Beds
3
Baths
1,806
Sq Ft
$242/Sq Ft
Est. Value
About This Home
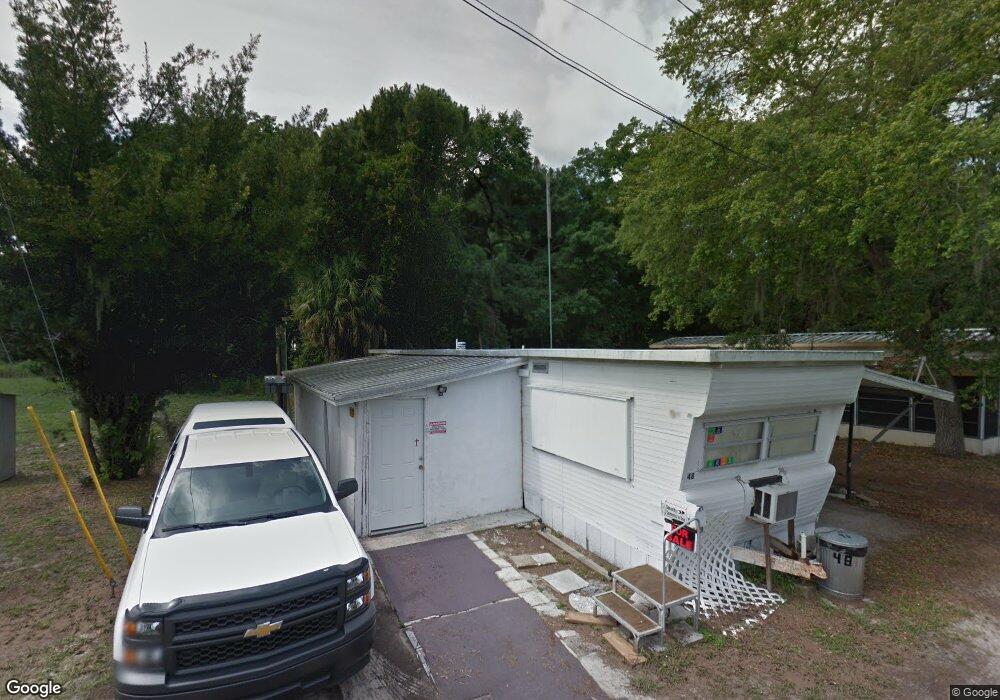
This home is located at 2807 48, Bradenton, FL 34207 and is currently estimated at $436,596, approximately $241 per square foot. 2807 48 is a home located in Manatee County with nearby schools including H. S. Moody Elementary School, W. D. Sugg Middle School, and Bayshore High School.
Ownership History
Date
Name
Owned For
Owner Type
Purchase Details
Closed on
Sep 17, 2010
Sold by
Federal Home Loan Mortgage Corporation
Bought by
Clevenger Matthew R
Current Estimated Value
Home Financials for this Owner
Home Financials are based on the most recent Mortgage that was taken out on this home.
Original Mortgage
$155,406
Outstanding Balance
$102,672
Interest Rate
4.45%
Mortgage Type
FHA
Estimated Equity
$333,924
Purchase Details
Closed on
Aug 16, 2010
Sold by
Bac Home Loans Servicing Lp
Bought by
Federal Home Loan Mortgage Corp
Home Financials for this Owner
Home Financials are based on the most recent Mortgage that was taken out on this home.
Original Mortgage
$155,406
Outstanding Balance
$102,672
Interest Rate
4.45%
Mortgage Type
FHA
Estimated Equity
$333,924
Purchase Details
Closed on
Jun 28, 2010
Sold by
Mcmanus Dennis J and Mcmanus Shelly L
Bought by
Bac Home Loans Servicing Lp and Countrywide Home Loans Servicing L P
Create a Home Valuation Report for This Property
The Home Valuation Report is an in-depth analysis detailing your home's value as well as a comparison with similar homes in the area
Home Values in the Area
Average Home Value in this Area
Purchase History
| Date | Buyer | Sale Price | Title Company |
|---|---|---|---|
| Clevenger Matthew R | $157,500 | New House Title | |
| Federal Home Loan Mortgage Corp | -- | New House Title | |
| Bac Home Loans Servicing Lp | $92,300 | None Available |
Source: Public Records
Mortgage History
| Date | Status | Borrower | Loan Amount |
|---|---|---|---|
| Open | Clevenger Matthew R | $155,406 |
Source: Public Records
Tax History
| Year | Tax Paid | Tax Assessment Tax Assessment Total Assessment is a certain percentage of the fair market value that is determined by local assessors to be the total taxable value of land and additions on the property. | Land | Improvement |
|---|---|---|---|---|
| 2025 | $5,196 | $340,182 | $79,900 | $260,282 |
| 2023 | $4,979 | $343,707 | $71,400 | $272,307 |
| 2022 | $4,497 | $301,095 | $70,000 | $231,095 |
| 2021 | $3,875 | $244,909 | $60,000 | $184,909 |
| 2020 | $3,689 | $220,437 | $50,000 | $170,437 |
| 2019 | $3,557 | $216,197 | $50,000 | $166,197 |
| 2018 | $3,417 | $214,877 | $50,000 | $164,877 |
| 2017 | $3,029 | $204,002 | $0 | $0 |
| 2016 | $2,868 | $191,669 | $0 | $0 |
Source: Public Records
Map
Nearby Homes
- 4613 Park Lake Terrace S Unit B32
- 4904 27th Ave W
- 4534 Park Lake Terrace N
- 4527 Park Lake Terrace N Unit 6
- 4811 26th Ave W
- 4535 Park Lake Terrace S Unit 28
- 4903 26th Ave W
- 4425 Park Lake Terrace N
- 4509 Park Lake Terrace N Unit 4
- 2906 Oak Ln Unit 24
- 4408 Park Lake Terrace S Unit 1
- 2907 Oak Ln Unit 21
- 5112 26th Ave W
- 2902 42nd St W
- 2207 51st St W
- 4903 21st Ave W
- 3216 42nd St W
- 3730 Pinebrook Cir Unit 103
- 3730 Pinebrook Cir Unit 404
- 5003 20th Ave W
Your Personal Tour Guide
Ask me questions while you tour the home.