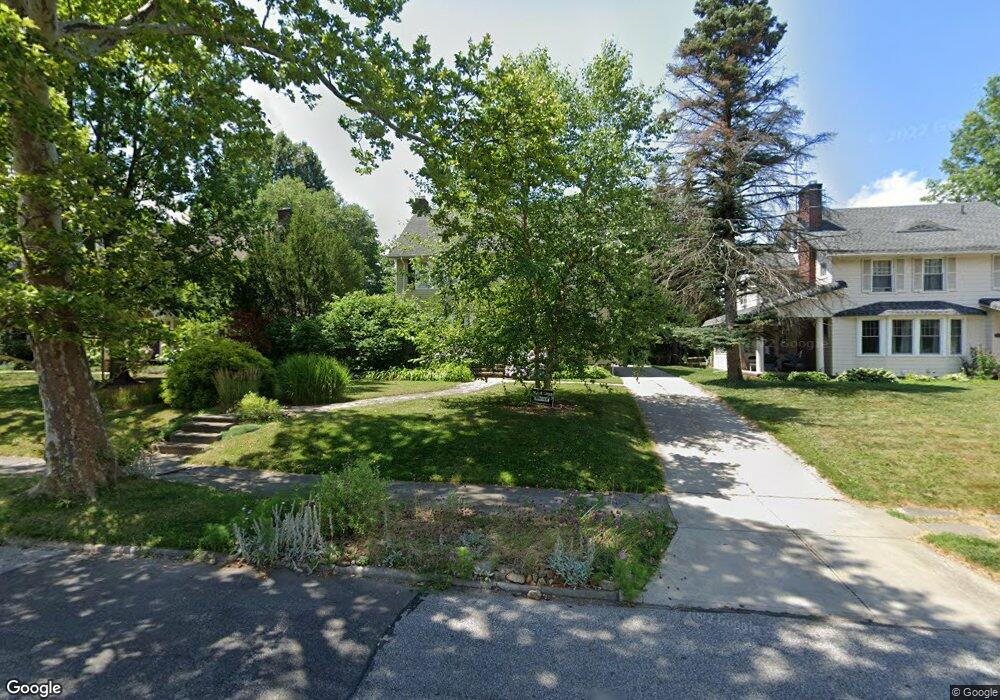
2808 Chadbourne Rd Cleveland, OH 44120
Buckeye-Shaker NeighborhoodEstimated Value: $237,672 - $327,000
4
Beds
3
Baths
1,918
Sq Ft
$148/Sq Ft
Est. Value
About This Home
This home is located at 2808 Chadbourne Rd, Cleveland, OH 44120 and is currently estimated at $283,668, approximately $147 per square foot. 2808 Chadbourne Rd is a home located in Cuyahoga County with nearby schools including Boulevard Elementary School, Woodbury Elementary School, and Shaker Heights Middle School.
Ownership History
Date
Name
Owned For
Owner Type
Purchase Details
Closed on
Mar 24, 2009
Sold by
Meckler William G and Van Atta Jeanne
Bought by
Meckler William G and Van Atta Jeanne
Current Estimated Value
Purchase Details
Closed on
Feb 20, 2002
Sold by
Meckler William G
Bought by
Meckler William G and Vanatta Jeanne
Home Financials for this Owner
Home Financials are based on the most recent Mortgage that was taken out on this home.
Original Mortgage
$82,050
Interest Rate
6.61%
Purchase Details
Closed on
Oct 30, 1985
Sold by
Zimmerman Mark D
Bought by
Meckler William G
Purchase Details
Closed on
Apr 29, 1977
Sold by
Huston John H
Bought by
Zimmerman Mark D
Purchase Details
Closed on
Apr 26, 1976
Sold by
Ramsdell Jean L Fox
Bought by
Huston John H
Purchase Details
Closed on
Jul 14, 1975
Sold by
Fox Edna M
Bought by
Ramsdell Jean L Fox
Purchase Details
Closed on
Jan 1, 1975
Bought by
Fox Edna M
Create a Home Valuation Report for This Property
The Home Valuation Report is an in-depth analysis detailing your home's value as well as a comparison with similar homes in the area
Home Values in the Area
Average Home Value in this Area
Purchase History
| Date | Buyer | Sale Price | Title Company |
|---|---|---|---|
| Meckler William G | -- | Attorney | |
| Meckler William G | -- | Executive Title Agency Corp | |
| Meckler William G | $77,000 | -- | |
| Zimmerman Mark D | $55,000 | -- | |
| Huston John H | $30,700 | -- | |
| Ramsdell Jean L Fox | -- | -- | |
| Fox Edna M | -- | -- |
Source: Public Records
Mortgage History
| Date | Status | Borrower | Loan Amount |
|---|---|---|---|
| Closed | Meckler William G | $82,050 |
Source: Public Records
Tax History Compared to Growth
Tax History
| Year | Tax Paid | Tax Assessment Tax Assessment Total Assessment is a certain percentage of the fair market value that is determined by local assessors to be the total taxable value of land and additions on the property. | Land | Improvement |
|---|---|---|---|---|
| 2024 | $6,067 | $76,930 | $12,495 | $64,435 |
| 2023 | $4,956 | $52,640 | $13,090 | $39,550 |
| 2022 | $4,838 | $52,640 | $13,090 | $39,550 |
| 2021 | $4,821 | $52,640 | $13,090 | $39,550 |
| 2020 | $4,241 | $45,010 | $11,200 | $33,810 |
| 2019 | $4,180 | $128,600 | $32,000 | $96,600 |
| 2018 | $4,204 | $45,010 | $11,200 | $33,810 |
| 2017 | $3,065 | $33,920 | $9,380 | $24,540 |
| 2016 | $2,943 | $33,920 | $9,380 | $24,540 |
| 2015 | $3,508 | $33,920 | $9,380 | $24,540 |
| 2014 | $3,508 | $37,700 | $10,430 | $27,270 |
Source: Public Records
Map
Nearby Homes
- 13707 Drexmore Rd
- 13710 Shaker Blvd Unit 405
- 2808 Van Aken Blvd Unit 1
- 2946 Ludlow Rd
- 2876 Ludlow Rd
- 13715 Shaker Blvd Unit 1B
- 13715 Shaker Blvd Unit 1A
- 13415 Shaker Blvd Unit 8D2
- 13415 Shaker Blvd Unit 12K3
- 13415 Shaker Blvd Unit 12M4 and 12N4
- 13605 Shaker Blvd Unit 2B
- 13615 Shaker Blvd Unit 1A
- 14221 S Woodland Rd
- 2931 S Moreland Blvd
- 14500 Shaker Blvd
- 2917 Warrington Rd
- 2965 S Moreland Blvd
- 2939 E 130th St
- 2938 E 130th St
- 3024 Becket Rd
- 2814 Chadbourne Rd
- 2802 Chadbourne Rd
- 2820 Chadbourne Rd
- 2796 Chadbourne Rd
- 2826 Chadbourne Rd
- 13610 Drexmore Rd
- 2832 Chadbourne Rd
- 13713 Drexmore Rd
- 13701 Drexmore Rd
- 13801 Drexmore Rd
- 2838 Chadbourne Rd
- 2809 Van Aken Blvd
- 2809-2949 Van Aken Blvd
- 13617 Drexmore Rd
- 13807 Drexmore Rd
- 13611 Drexmore Rd
- 13815 Drexmore Rd
- 2844 Chadbourne Rd
- 13609 Drexmore Rd
- 13817 Drexmore Rd