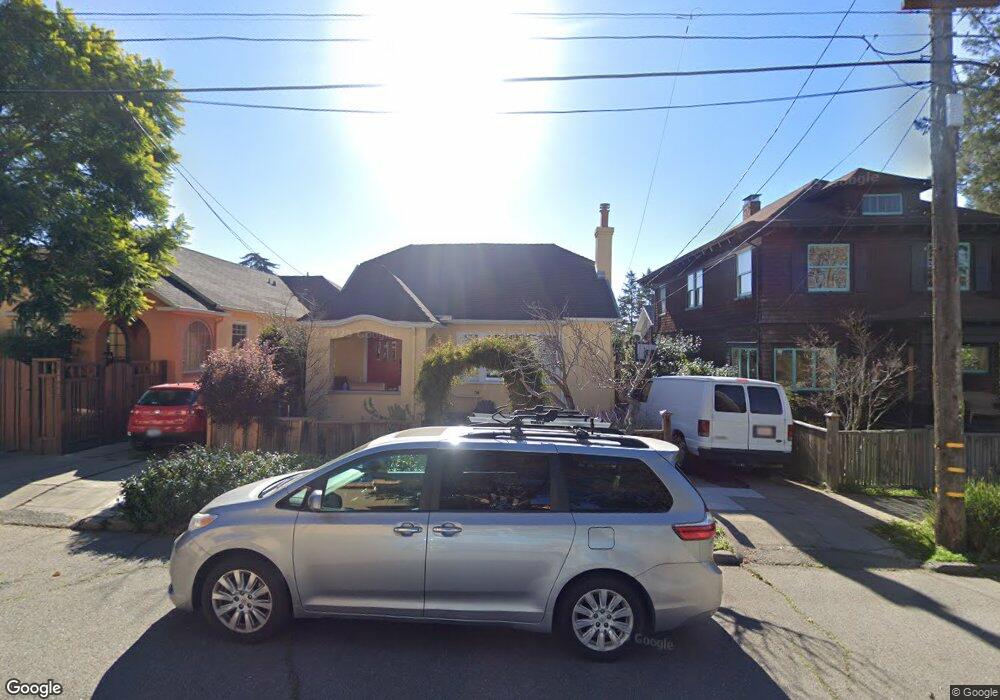
2808 Garber St Berkeley, CA 94705
Claremont NeighborhoodEstimated Value: $1,525,000 - $2,301,000
2
Beds
3
Baths
2,050
Sq Ft
$925/Sq Ft
Est. Value
About This Home
This home is located at 2808 Garber St, Berkeley, CA 94705 and is currently estimated at $1,896,317, approximately $925 per square foot. 2808 Garber St is a home located in Alameda County with nearby schools including Emerson Elementary School, John Muir Elementary School, and Malcolm X Elementary School.
Ownership History
Date
Name
Owned For
Owner Type
Purchase Details
Closed on
Jul 3, 2014
Sold by
Lurquin Thomas J
Bought by
Lurquin Thomas J
Current Estimated Value
Home Financials for this Owner
Home Financials are based on the most recent Mortgage that was taken out on this home.
Original Mortgage
$670,000
Outstanding Balance
$508,613
Interest Rate
4.07%
Mortgage Type
New Conventional
Estimated Equity
$1,387,704
Purchase Details
Closed on
Jul 22, 2013
Sold by
Lurquin Amy B
Bought by
Lurquin Thomas J
Home Financials for this Owner
Home Financials are based on the most recent Mortgage that was taken out on this home.
Original Mortgage
$651,200
Interest Rate
3.92%
Mortgage Type
New Conventional
Purchase Details
Closed on
Feb 8, 2012
Sold by
Lurquin Thomas J and Lurquin Amy B
Bought by
Lurquin Thomas J and Lurquin Amy B
Home Financials for this Owner
Home Financials are based on the most recent Mortgage that was taken out on this home.
Original Mortgage
$530,000
Interest Rate
3.83%
Mortgage Type
New Conventional
Purchase Details
Closed on
Mar 14, 2005
Sold by
Aalami Oliver O and Rothenberg Aalami Jessica
Bought by
Lurquin Thomas J and Shaffer Amy B
Home Financials for this Owner
Home Financials are based on the most recent Mortgage that was taken out on this home.
Original Mortgage
$550,000
Interest Rate
5.37%
Mortgage Type
Purchase Money Mortgage
Purchase Details
Closed on
Oct 19, 2002
Sold by
Aalami Oliver O and Rothenberg Aalami Jessica
Bought by
Aalami Oliver O and Rothenberg Aalami Jessica
Home Financials for this Owner
Home Financials are based on the most recent Mortgage that was taken out on this home.
Original Mortgage
$352,950
Interest Rate
5.87%
Mortgage Type
Purchase Money Mortgage
Purchase Details
Closed on
Aug 7, 1998
Sold by
Mellon David M and Strugnell Lori M
Bought by
Aalami Oliver O and Rothenberg Aalami Jessica
Home Financials for this Owner
Home Financials are based on the most recent Mortgage that was taken out on this home.
Original Mortgage
$246,000
Interest Rate
7%
Mortgage Type
Purchase Money Mortgage
Purchase Details
Closed on
Sep 9, 1997
Sold by
Brothers Anita U and Uhl Anita Uhl
Bought by
Mellon David M and Strugnell Lori M
Home Financials for this Owner
Home Financials are based on the most recent Mortgage that was taken out on this home.
Original Mortgage
$278,100
Interest Rate
7.45%
Mortgage Type
Purchase Money Mortgage
Create a Home Valuation Report for This Property
The Home Valuation Report is an in-depth analysis detailing your home's value as well as a comparison with similar homes in the area
Home Values in the Area
Average Home Value in this Area
Purchase History
| Date | Buyer | Sale Price | Title Company |
|---|---|---|---|
| Lurquin Thomas J | -- | Chicago Title Company | |
| Lurquin Thomas J | -- | First American Title Company | |
| Lurquin Thomas J | $177,000 | Chicago Title Company | |
| Lurquin Thomas J | $879,000 | Placer Title Company | |
| Aalami Oliver O | $176,500 | -- | |
| Aalami Oliver O | $378,500 | Placer Title Company | |
| Mellon David M | $309,000 | Fidelity National Title Co |
Source: Public Records
Mortgage History
| Date | Status | Borrower | Loan Amount |
|---|---|---|---|
| Open | Lurquin Thomas J | $670,000 | |
| Closed | Lurquin Thomas J | $651,200 | |
| Closed | Lurquin Thomas J | $530,000 | |
| Previous Owner | Lurquin Thomas J | $550,000 | |
| Previous Owner | Aalami Oliver O | $352,950 | |
| Previous Owner | Aalami Oliver O | $246,000 | |
| Previous Owner | Mellon David M | $278,100 |
Source: Public Records
Tax History
| Year | Tax Paid | Tax Assessment Tax Assessment Total Assessment is a certain percentage of the fair market value that is determined by local assessors to be the total taxable value of land and additions on the property. | Land | Improvement |
|---|---|---|---|---|
| 2025 | $17,989 | $1,222,621 | $354,923 | $874,698 |
| 2024 | $17,989 | $1,198,518 | $347,966 | $857,552 |
| 2023 | $17,623 | $1,181,884 | $341,144 | $840,740 |
| 2022 | $17,326 | $1,151,714 | $334,456 | $824,258 |
| 2021 | $17,608 | $1,128,998 | $327,899 | $808,099 |
| 2020 | $15,585 | $1,081,795 | $324,538 | $757,257 |
| 2019 | $15,039 | $1,060,591 | $318,177 | $742,414 |
| 2018 | $14,803 | $1,039,804 | $311,941 | $727,863 |
| 2017 | $14,382 | $1,019,422 | $305,826 | $713,596 |
| 2016 | $13,972 | $999,438 | $299,831 | $699,607 |
| 2015 | $13,795 | $984,432 | $295,329 | $689,103 |
| 2014 | $13,719 | $965,154 | $289,546 | $675,608 |
Source: Public Records
Map
Nearby Homes
- 2817 Palm Ct
- 2632 Warring St Unit 3
- 2643 Stuart St
- 2601 College Ave Unit 203
- 2601 College Ave Unit 208
- 2962 Piedmont Ave
- 190 Stonewall Rd
- 2935 Florence St
- 2535 Chilton Way
- 2702 Dana St
- 2917 Telegraph Ave
- 2509 Dwight Way
- 2477 Prince St
- 2319 Ward St
- 2 Panoramic Way Unit 105
- 2 Panoramic Way Unit 304
- 161 Panoramic Way
- 2550 Dana St Unit 2F
- 0 Panoramic Way Unit 41118724
- 6446 Colby St
- 2802 Garber St
- 2812 Garber St
- 2753 Piedmont Ave
- 2800 Garber St
- 2816 Garber St
- 2820 Garber St
- 2811 Stuart St Unit 1
- 2811 Stuart St Unit 2
- 2813 Stuart St
- 2809 Stuart St
- 2805 Stuart St
- 2815 Stuart St
- 2746 Garber St
- 2822 Garber St
- 2752 Piedmont Ave
- 2754 Piedmont Ave
- 2823 Palm Ct
- 2758 Piedmont Ave
- 2742 Garber St
- 2734 Piedmont Ave
Your Personal Tour Guide
Ask me questions while you tour the home.