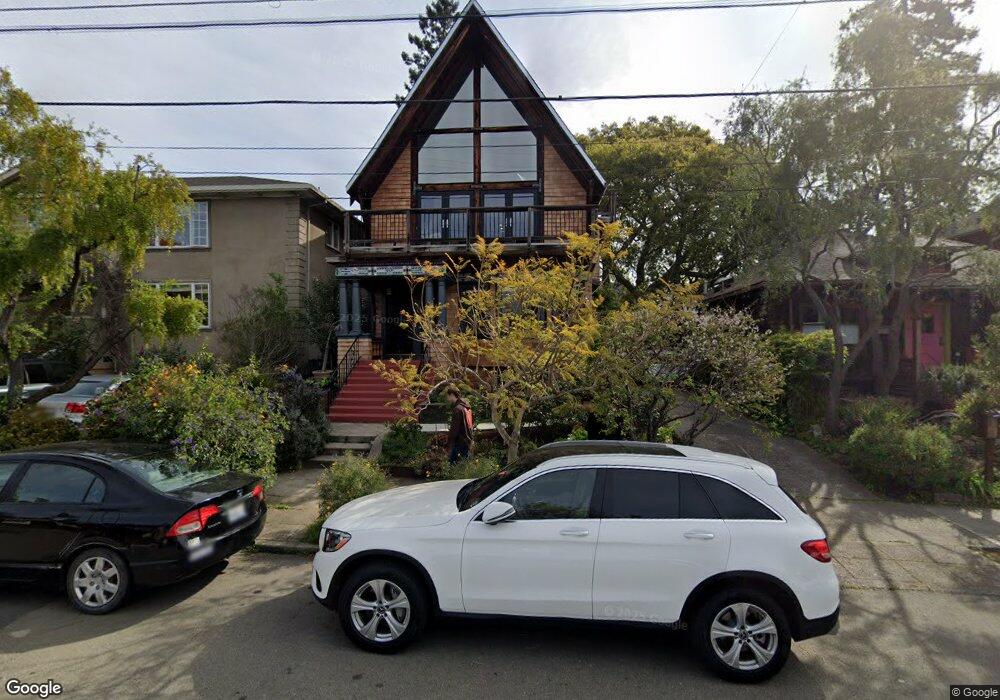
2809 Cherry St Berkeley, CA 94705
Elmwood NeighborhoodEstimated Value: $2,388,000 - $2,730,591
Studio
5
Baths
2,583
Sq Ft
$1,000/Sq Ft
Est. Value
About This Home
This home is located at 2809 Cherry St, Berkeley, CA 94705 and is currently estimated at $2,583,648, approximately $1,000 per square foot. 2809 Cherry St is a home located in Alameda County with nearby schools including Emerson Elementary School, John Muir Elementary School, and Malcolm X Elementary School.
Ownership History
Date
Name
Owned For
Owner Type
Purchase Details
Closed on
Jul 23, 2024
Sold by
Abraham/Crosgrove Living Trust and Abraham Roger
Bought by
Trope Alexander and Trope Lee
Current Estimated Value
Home Financials for this Owner
Home Financials are based on the most recent Mortgage that was taken out on this home.
Original Mortgage
$1,100,000
Outstanding Balance
$1,081,454
Interest Rate
6.86%
Mortgage Type
New Conventional
Estimated Equity
$1,502,194
Purchase Details
Closed on
Dec 6, 2011
Sold by
Sasaki Mimi Avril and Sasaki Brion R
Bought by
Abraham Roger and Grosgrove Maureen
Purchase Details
Closed on
Jul 22, 2002
Sold by
Oyama Joseph Robert and Oyama Richard R
Bought by
Sasaki Yasuo and Sasaki Lili Y
Purchase Details
Closed on
Aug 9, 1999
Sold by
Oyama Joseph T
Bought by
Oyama Joseph Robert and Oyama Richard R
Create a Home Valuation Report for This Property
The Home Valuation Report is an in-depth analysis detailing your home's value as well as a comparison with similar homes in the area
Home Values in the Area
Average Home Value in this Area
Purchase History
| Date | Buyer | Sale Price | Title Company |
|---|---|---|---|
| Trope Alexander | $2,700,000 | Chicago Title | |
| Abraham Roger | $772,000 | Old Republic Title Company | |
| Sasaki Yasuo | $350,000 | -- | |
| Oyama Joseph Robert | -- | -- |
Source: Public Records
Mortgage History
| Date | Status | Borrower | Loan Amount |
|---|---|---|---|
| Open | Trope Alexander | $1,100,000 |
Source: Public Records
Tax History
| Year | Tax Paid | Tax Assessment Tax Assessment Total Assessment is a certain percentage of the fair market value that is determined by local assessors to be the total taxable value of land and additions on the property. | Land | Improvement |
|---|---|---|---|---|
| 2025 | $9,473 | $2,700,000 | $810,000 | $1,890,000 |
| 2024 | $9,473 | $371,105 | $66,660 | $311,445 |
| 2023 | $9,187 | $370,693 | $65,353 | $305,340 |
| 2022 | $8,887 | $356,426 | $64,072 | $299,354 |
| 2021 | $8,860 | $349,301 | $62,816 | $293,485 |
| 2020 | $8,221 | $352,649 | $62,172 | $290,477 |
| 2019 | $7,710 | $345,736 | $60,953 | $284,783 |
| 2018 | $7,526 | $338,961 | $59,759 | $279,202 |
| 2017 | $7,245 | $332,316 | $58,587 | $273,729 |
| 2016 | $6,875 | $325,802 | $57,439 | $268,363 |
| 2015 | $6,754 | $320,909 | $56,576 | $264,333 |
| 2014 | $6,566 | $314,624 | $55,468 | $259,156 |
Source: Public Records
Map
Nearby Homes
- 2643 Stuart St
- 2817 Palm Ct
- 2632 Warring St Unit 3
- 2601 College Ave Unit 203
- 2601 College Ave Unit 208
- 2962 Piedmont Ave
- 2935 Florence St
- 2702 Dana St
- 2535 Chilton Way
- 2917 Telegraph Ave
- 2509 Dwight Way
- 2477 Prince St
- 2319 Ward St
- 2550 Dana St Unit 2F
- 190 Stonewall Rd
- 6446 Colby St
- 2243 Ashby Ave
- 2 Panoramic Way Unit 105
- 2 Panoramic Way Unit 304
- 161 Panoramic Way
- 2811 Cherry St
- 2801 Cherry St
- 2720 Stuart St
- 2728 Stuart St
- 2815 Cherry St
- 2730 Stuart St
- 2817 Cherry St
- 2804 Piedmont Ave
- 2810 Piedmont Ave
- 2812 Piedmont Ave
- 2814 Piedmont Ave
- 2804 Cherry St
- 2821 Cherry St
- 2806 Cherry St
- 2716 Stuart St
- 2800 Piedmont Ave
- 2820 Piedmont Ave
- 2818 Piedmont Ave
- 2823 Cherry St
- 2814 Cherry St
Your Personal Tour Guide
Ask me questions while you tour the home.