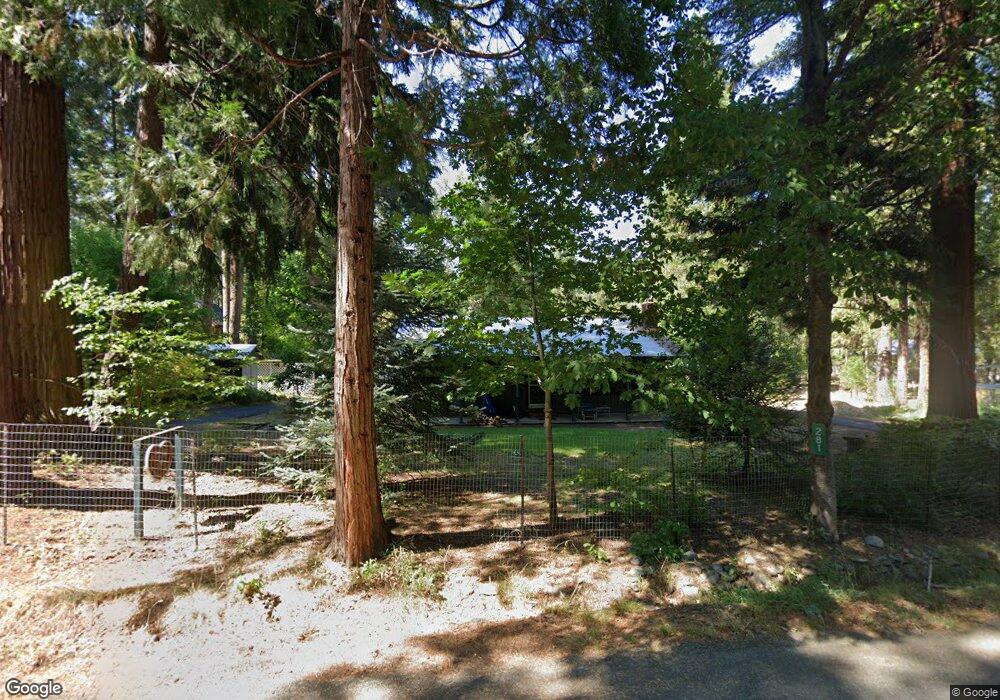
281 Mann Rd Trinity Center, CA 96091
Estimated Value: $228,958 - $426,000
2
Beds
1
Bath
954
Sq Ft
$340/Sq Ft
Est. Value
About This Home
This home is located at 281 Mann Rd, Trinity Center, CA 96091 and is currently estimated at $324,490, approximately $340 per square foot. 281 Mann Rd is a home with nearby schools including Coffee Creek Elementary School, Weaverville Elementary School, and Trinity High School.
Ownership History
Date
Name
Owned For
Owner Type
Purchase Details
Closed on
Mar 26, 2019
Sold by
Dillon Regan L and Braman Cindy Rae
Bought by
Dillon Regan L and Braman Cindy Rae
Current Estimated Value
Purchase Details
Closed on
Jul 25, 2011
Sold by
Brusnighan John L and Brusnighan Judy Ann
Bought by
Dillon Regan and Braman Cindy Rae
Home Financials for this Owner
Home Financials are based on the most recent Mortgage that was taken out on this home.
Original Mortgage
$84,000
Outstanding Balance
$57,844
Interest Rate
4.53%
Mortgage Type
New Conventional
Estimated Equity
$266,646
Purchase Details
Closed on
Feb 9, 2006
Sold by
Brusnighan John L and Brusnighan Judy A
Bought by
Brusnighan John L and Brusnighan Judy Ann
Create a Home Valuation Report for This Property
The Home Valuation Report is an in-depth analysis detailing your home's value as well as a comparison with similar homes in the area
Purchase History
| Date | Buyer | Sale Price | Title Company |
|---|---|---|---|
| Dillon Regan L | -- | None Available | |
| Dillon Regan | $152,500 | Trinity Co Title Co | |
| Brusnighan John L | -- | None Available |
Source: Public Records
Mortgage History
| Date | Status | Borrower | Loan Amount |
|---|---|---|---|
| Open | Dillon Regan | $84,000 |
Source: Public Records
Tax History
| Year | Tax Paid | Tax Assessment Tax Assessment Total Assessment is a certain percentage of the fair market value that is determined by local assessors to be the total taxable value of land and additions on the property. | Land | Improvement |
|---|---|---|---|---|
| 2025 | $1,881 | $191,536 | $69,704 | $121,832 |
| 2024 | $1,848 | $187,782 | $68,338 | $119,444 |
| 2023 | $1,848 | $184,101 | $66,999 | $117,102 |
| 2022 | $1,803 | $180,492 | $65,686 | $114,806 |
| 2021 | $1,772 | $176,954 | $64,399 | $112,555 |
| 2020 | $1,721 | $175,140 | $63,739 | $111,401 |
| 2019 | $1,700 | $171,707 | $62,490 | $109,217 |
| 2018 | $1,700 | $168,341 | $61,265 | $107,076 |
| 2017 | $1,694 | $165,041 | $60,064 | $104,977 |
| 2016 | $1,627 | $161,806 | $58,887 | $102,919 |
| 2015 | $1,602 | $159,377 | $58,003 | $101,374 |
| 2014 | $1,714 | $156,256 | $56,867 | $99,389 |
Source: Public Records
Map
Nearby Homes
- 107 Cedar Rd
- 261 Ridgewood Rd
- 10 Estabrook Ln
- 2103 Coffee Creek Rd
- 121 & 141 Mountain Aire Ln
- 3931 Coffee Creek
- 1371 Eagle Creek Loop
- 1371 Eagle Creek Loop Rd
- 279 Placer Dr
- 268 Placer Dr
- 131 Northwoods Estates
- 131 N
- 71 Mary
- 220 & 230 Lakeview
- 220 & 230 Lakeview Dr
- 230 N Lakeview Dr
- 230 Mary Ave
- 250 Mary Ave
- 8341 E Side Rd
- 8341 E East Side Rd
Your Personal Tour Guide
Ask me questions while you tour the home.