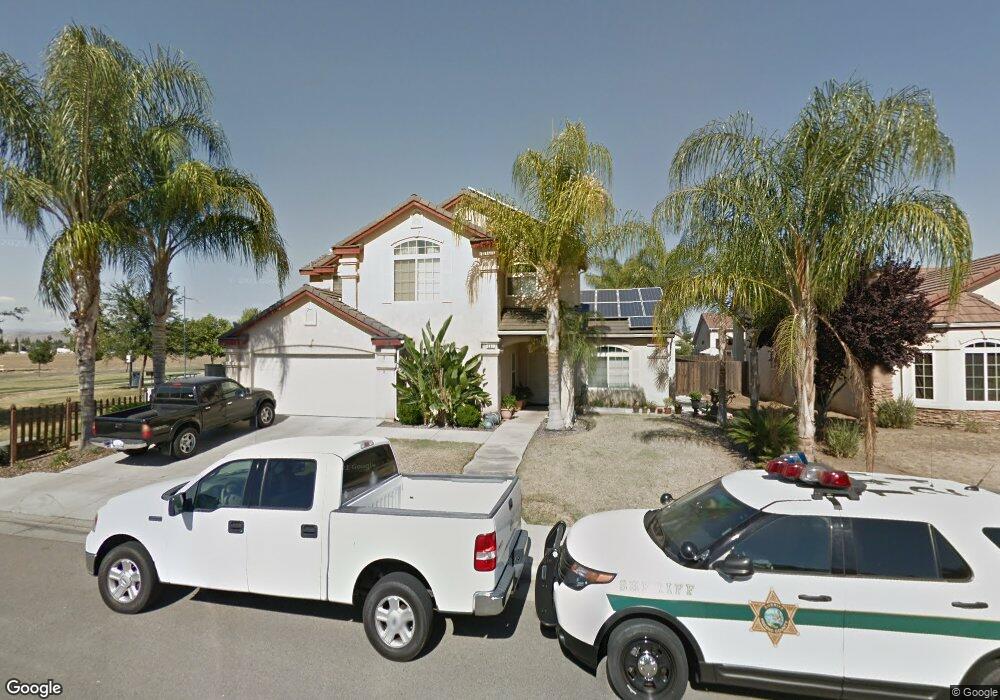
281 N Helm Ave Clovis, CA 93612
Estimated Value: $543,647 - $609,000
4
Beds
3
Baths
2,398
Sq Ft
$244/Sq Ft
Est. Value
About This Home
This home is located at 281 N Helm Ave, Clovis, CA 93612 and is currently estimated at $586,216, approximately $244 per square foot. 281 N Helm Ave is a home located in Fresno County with nearby schools including Cole Elementary School, Alta Sierra Intermediate School, and Buchanan High School.
Ownership History
Date
Name
Owned For
Owner Type
Purchase Details
Closed on
Mar 29, 2014
Sold by
Souphasith Steven and Souphasith Nida
Bought by
Souphasith Steven
Current Estimated Value
Home Financials for this Owner
Home Financials are based on the most recent Mortgage that was taken out on this home.
Original Mortgage
$275,958
Outstanding Balance
$209,463
Interest Rate
4.3%
Mortgage Type
VA
Estimated Equity
$376,753
Purchase Details
Closed on
Aug 21, 2006
Sold by
Souphasith Steven
Bought by
Souphasith Steven and Souphasith Nida
Purchase Details
Closed on
Jun 1, 2004
Sold by
Bh5115 Lp
Bought by
Souphasith Steven
Home Financials for this Owner
Home Financials are based on the most recent Mortgage that was taken out on this home.
Original Mortgage
$260,281
Interest Rate
6.09%
Mortgage Type
Purchase Money Mortgage
Purchase Details
Closed on
Feb 27, 2004
Sold by
Souphasith Boun Home Dawn
Bought by
Souphasith Steven
Create a Home Valuation Report for This Property
The Home Valuation Report is an in-depth analysis detailing your home's value as well as a comparison with similar homes in the area
Home Values in the Area
Average Home Value in this Area
Purchase History
| Date | Buyer | Sale Price | Title Company |
|---|---|---|---|
| Souphasith Steven | -- | None Available | |
| Souphasith Steven | -- | None Available | |
| Souphasith Nida | -- | None Available | |
| Souphasith Steven | $274,000 | Chicago Title Co | |
| Souphasith Steven | -- | Chicago Title Co |
Source: Public Records
Mortgage History
| Date | Status | Borrower | Loan Amount |
|---|---|---|---|
| Open | Souphasith Steven | $275,958 | |
| Closed | Souphasith Steven | $260,281 |
Source: Public Records
Tax History
| Year | Tax Paid | Tax Assessment Tax Assessment Total Assessment is a certain percentage of the fair market value that is determined by local assessors to be the total taxable value of land and additions on the property. | Land | Improvement |
|---|---|---|---|---|
| 2025 | $4,736 | $388,840 | $85,298 | $303,542 |
| 2023 | $4,541 | $373,743 | $81,987 | $291,756 |
| 2022 | $4,482 | $366,416 | $80,380 | $286,036 |
| 2021 | $4,340 | $359,232 | $78,804 | $280,428 |
| 2020 | $4,314 | $355,549 | $77,996 | $277,553 |
| 2019 | $4,232 | $348,578 | $76,467 | $272,111 |
| 2018 | $4,134 | $341,744 | $74,968 | $266,776 |
| 2017 | $4,058 | $335,045 | $73,499 | $261,546 |
| 2016 | $3,924 | $328,476 | $72,058 | $256,418 |
| 2015 | $3,852 | $323,543 | $70,976 | $252,567 |
| 2014 | -- | $317,206 | $69,586 | $247,620 |
Source: Public Records
Map
Nearby Homes
- 131 N Terry Ave
- 351 N Peach Ave
- 602 W Mahogany Ln
- 484 W Balsam Ln
- 288 W Magill Ave
- 684 W Chennault Ave
- 742 W Ellery Ave
- 0 Willow Bluff Unit 638378
- 450 W Alluvial Ave
- 345 Sylmar Ave
- 474 W Windsor Ave
- 6706 N Chestnut Ave Unit 118
- 2669 E Sean Ave
- 560 W Stuart Ave
- 445 Quill Ln
- 493 Timmy Ave
- 2625 E Sean Ave
- 6620 N Dearing Ave
- 570 Timmy Ave
- 595 Quill Ln
- 271 N Helm Ave
- 278 N Cindy Ave
- 261 N Helm Ave
- 268 N Cindy Ave
- 282 N Helm Ave
- 258 N Cindy Ave
- 515 W Fremont Ave
- 251 N Helm Ave
- 272 N Helm Ave
- 248 N Cindy Ave
- 535 W Fremont Ave
- 252 N Helm Ave
- 498 W Fremont Ave
- 241 N Helm Ave
- 495 W Fremont Ave
- 283 N Anderson Ave
- 242 N Helm Ave
- 257 N Cindy Ave
- 273 N Anderson Ave
- 238 N Cindy Ave
Your Personal Tour Guide
Ask me questions while you tour the home.