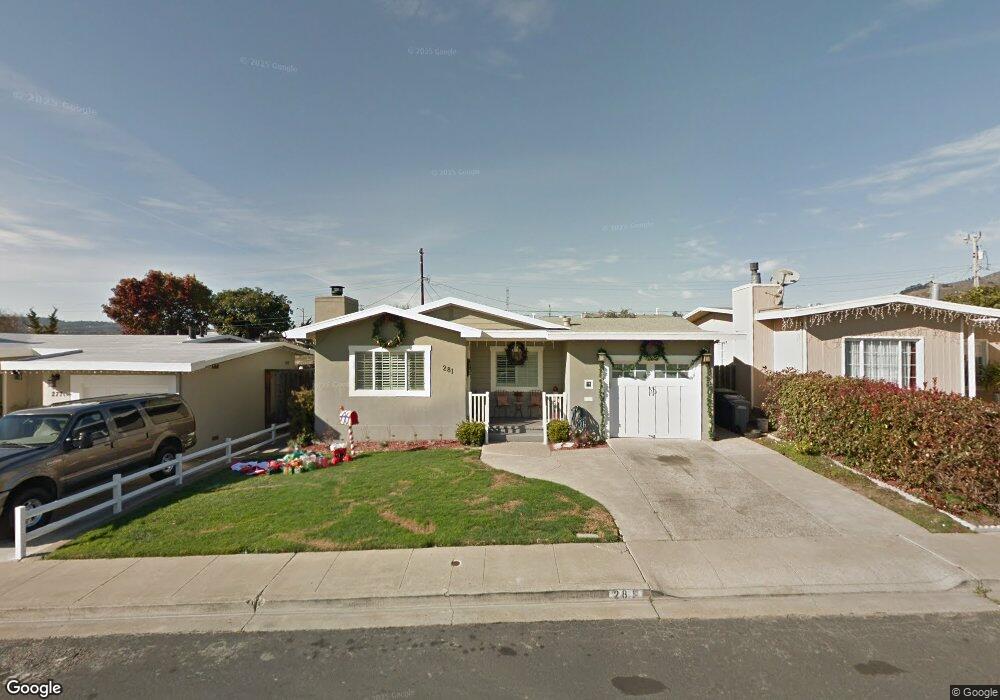
281 Sequoia Ave South San Francisco, CA 94080
Sunshine Gardens NeighborhoodEstimated Value: $1,073,000 - $1,225,000
3
Beds
1
Bath
1,000
Sq Ft
$1,174/Sq Ft
Est. Value
About This Home
This home is located at 281 Sequoia Ave, South San Francisco, CA 94080 and is currently estimated at $1,174,489, approximately $1,174 per square foot. 281 Sequoia Ave is a home located in San Mateo County with nearby schools including Sunshine Gardens Elementary School, Parkway Heights Middle School, and El Camino High School.
Ownership History
Date
Name
Owned For
Owner Type
Purchase Details
Closed on
Jul 12, 2024
Sold by
Downs Jeffrey Raymond and Downs Raquel
Bought by
2024 Downs Revocable Trust and Downs
Current Estimated Value
Purchase Details
Closed on
Apr 19, 2004
Sold by
Morris Ruben
Bought by
Downs Jeffrey Raymond and Downs Raquel
Home Financials for this Owner
Home Financials are based on the most recent Mortgage that was taken out on this home.
Original Mortgage
$447,000
Interest Rate
5.12%
Mortgage Type
Purchase Money Mortgage
Purchase Details
Closed on
Dec 31, 1998
Sold by
Moreno Aurora Revocable Trust and Morris George
Bought by
Morris Rubin
Purchase Details
Closed on
Feb 12, 1997
Sold by
Aurora Moreno and Aurora A
Bought by
Moreno Aurora S
Create a Home Valuation Report for This Property
The Home Valuation Report is an in-depth analysis detailing your home's value as well as a comparison with similar homes in the area
Home Values in the Area
Average Home Value in this Area
Purchase History
| Date | Buyer | Sale Price | Title Company |
|---|---|---|---|
| 2024 Downs Revocable Trust | -- | None Listed On Document | |
| Downs Jeffrey Raymond | -- | None Listed On Document | |
| Downs Jeffrey Raymond | $559,000 | First American Title Co | |
| Morris Rubin | -- | -- | |
| Moreno Aurora S | -- | -- |
Source: Public Records
Mortgage History
| Date | Status | Borrower | Loan Amount |
|---|---|---|---|
| Previous Owner | Downs Jeffrey Raymond | $447,000 | |
| Closed | Downs Jeffrey Raymond | $56,000 |
Source: Public Records
Tax History Compared to Growth
Tax History
| Year | Tax Paid | Tax Assessment Tax Assessment Total Assessment is a certain percentage of the fair market value that is determined by local assessors to be the total taxable value of land and additions on the property. | Land | Improvement |
|---|---|---|---|---|
| 2025 | $9,341 | $794,762 | $397,381 | $397,381 |
| 2023 | $9,341 | $763,902 | $381,951 | $381,951 |
| 2022 | $8,679 | $748,924 | $374,462 | $374,462 |
| 2021 | $8,567 | $734,240 | $367,120 | $367,120 |
| 2020 | $8,462 | $726,712 | $363,356 | $363,356 |
| 2019 | $8,371 | $712,464 | $356,232 | $356,232 |
| 2018 | $8,172 | $698,496 | $349,248 | $349,248 |
| 2017 | $7,969 | $684,800 | $342,400 | $342,400 |
| 2016 | $7,814 | $671,374 | $335,687 | $335,687 |
| 2015 | $7,688 | $661,290 | $330,645 | $330,645 |
| 2014 | $6,900 | $590,000 | $295,000 | $295,000 |
Source: Public Records
Map
Nearby Homes
- 252 Sequoia Ave
- 1488 El Camino Real Unit 211
- 467 Holly Ave
- 250 Willow Ave Unit 421
- 889 Mclellan Dr Unit 205
- 889 Mclellan Dr Unit 302
- 829 Stonegate Dr
- 0 Indio Dr
- 1700 El Camino Real Unit 2-03
- 1700 El Camino Real Unit 17-7
- 1700 El Camino Real
- 728 Cottonwood Ave
- 729 Grand Ave
- 1 Elkwood Dr
- 3 Bradford Dr
- 556 Keoncrest Dr
- 706 Serra Dr
- 719 Circle Ct
- 69 Windcrest Ln
- 121 Northcrest Dr
- 285 Sequoia Ave
- 277 Sequoia Ave
- 289 Sequoia Ave
- 273 Sequoia Ave
- 280 Oakcrest Ave
- 276 Oakcrest Ave
- 284 Oakcrest Ave
- 272 Oakcrest Ave
- 288 Oakcrest Ave
- 293 Sequoia Ave
- 269 Sequoia Ave
- 280 Sequoia Ave
- 284 Sequoia Ave
- 276 Sequoia Ave
- 268 Oakcrest Ave
- 292 Oakcrest Ave
- 288 Sequoia Ave
- 297 Sequoia Ave
- 272 Sequoia Ave
- 265 Sequoia Ave