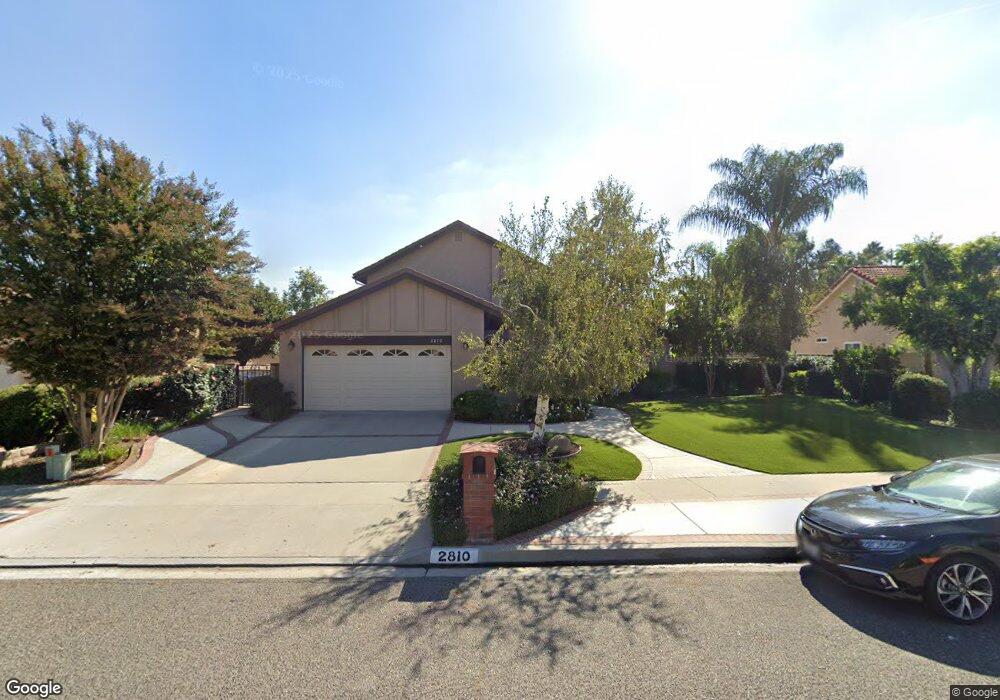
2810 Circle View Dr Simi Valley, CA 93063
Central Simi Valley NeighborhoodEstimated Value: $962,503 - $1,035,000
4
Beds
3
Baths
2,168
Sq Ft
$457/Sq Ft
Est. Value
About This Home
This home is located at 2810 Circle View Dr, Simi Valley, CA 93063 and is currently estimated at $991,126, approximately $457 per square foot. 2810 Circle View Dr is a home located in Ventura County with nearby schools including Township Elementary School, Valley View Middle School, and Simi Valley High School.
Ownership History
Date
Name
Owned For
Owner Type
Purchase Details
Closed on
Dec 22, 2011
Sold by
Ward Kenneth W and Ward Kim N
Bought by
Ward Kenneth W and Ward Kim N
Current Estimated Value
Home Financials for this Owner
Home Financials are based on the most recent Mortgage that was taken out on this home.
Original Mortgage
$148,496
Outstanding Balance
$15,976
Interest Rate
3.93%
Mortgage Type
New Conventional
Estimated Equity
$975,150
Purchase Details
Closed on
Oct 9, 2009
Sold by
Ward Kenneth W and Ward Kim N
Bought by
Ward Kenneth W and Ward Kim N
Purchase Details
Closed on
Sep 3, 2009
Sold by
Ward Kenneth W and Ward Kim N
Bought by
Ward Kenneth W and Ward Kim N
Purchase Details
Closed on
Nov 18, 1999
Sold by
Kbe Investments
Bought by
Ward Kenneth W and Ward Kim N
Home Financials for this Owner
Home Financials are based on the most recent Mortgage that was taken out on this home.
Original Mortgage
$225,200
Interest Rate
7.96%
Purchase Details
Closed on
Jul 21, 1999
Sold by
Dodson John M Laura
Bought by
Kbe Investments
Create a Home Valuation Report for This Property
The Home Valuation Report is an in-depth analysis detailing your home's value as well as a comparison with similar homes in the area
Home Values in the Area
Average Home Value in this Area
Purchase History
| Date | Buyer | Sale Price | Title Company |
|---|---|---|---|
| Ward Kenneth W | -- | First American Title Company | |
| Ward Kenneth W | -- | First American Title Company | |
| Ward Kenneth W | -- | None Available | |
| Ward Kenneth W | -- | None Available | |
| Ward Kenneth W | $281,500 | Chicago Title Insurance Co | |
| Kbe Investments | $255,000 | Chicago Title Co |
Source: Public Records
Mortgage History
| Date | Status | Borrower | Loan Amount |
|---|---|---|---|
| Open | Ward Kenneth W | $148,496 | |
| Closed | Ward Kenneth W | $225,200 |
Source: Public Records
Tax History
| Year | Tax Paid | Tax Assessment Tax Assessment Total Assessment is a certain percentage of the fair market value that is determined by local assessors to be the total taxable value of land and additions on the property. | Land | Improvement |
|---|---|---|---|---|
| 2025 | $6,171 | $489,520 | $173,049 | $316,471 |
| 2024 | $6,171 | $479,922 | $169,656 | $310,266 |
| 2023 | $5,812 | $470,512 | $166,329 | $304,183 |
| 2022 | $5,788 | $461,287 | $163,068 | $298,219 |
| 2021 | $5,745 | $452,243 | $159,871 | $292,372 |
| 2020 | $5,628 | $447,608 | $158,233 | $289,375 |
| 2019 | $5,380 | $438,832 | $155,131 | $283,701 |
| 2018 | $5,335 | $430,229 | $152,090 | $278,139 |
| 2017 | $5,219 | $421,794 | $149,108 | $272,686 |
| 2016 | $4,992 | $413,525 | $146,185 | $267,340 |
| 2015 | $4,890 | $407,315 | $143,990 | $263,325 |
| 2014 | $4,823 | $399,338 | $141,170 | $258,168 |
Source: Public Records
Map
Nearby Homes
- 2972 Ivory Ave
- 3445 Highwood Ct Unit 128
- 3417 Highwood Ct Unit 148
- 3279 Avenida Simi
- 6505 Canyon Oaks Dr
- 3474 Highwood Ct Unit 80
- 3434 Highwood Ct Unit 183
- 3458 Highwood Ct Unit 198
- 3550 Woodhaven St
- 2696 Santa Ynez Ave
- 3648 Woodhaven St
- 3259 Valarie Ave
- 3192 Darby St Unit 113
- 3210 Darby St Unit 102
- 2433 Medina Ave
- 3028 Harrison Ln
- 2727 Reservoir Dr
- 3010 Tallahassee Ln
- 3049 Tallahassee Ln
- 3067 Harrison Ln
- 2802 Circle View Dr
- 2816 Circle View Dr
- 2804 Tiffaney Ln
- 2824 Circle View Dr
- 2809 Emily Ln
- 2804 Kerry Dr
- 2830 Circle View Dr
- 2816 Tiffaney Ln
- 2797 Goldfield Place
- 2825 Emily Ln
- 2795 Goldfield Place
- 3480 Alamo St
- 2840 Circle View Dr
- 2799 Goldfield Place
- 2812 Emily Ln
- 2838 Circle View Dr
- 2812 Kerry Dr
- 2828 Tiffaney Ln
- 2798 Goldfield Place
- 2843 Emily Ln
Your Personal Tour Guide
Ask me questions while you tour the home.