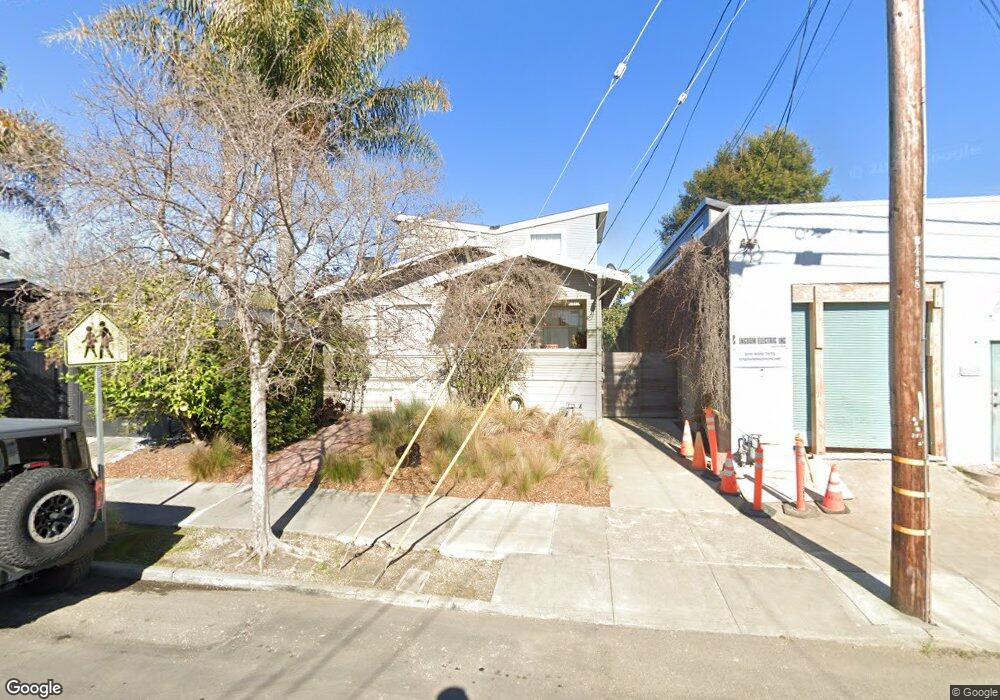
2811 8th St Berkeley, CA 94710
West Berkeley NeighborhoodEstimated Value: $826,568 - $1,228,000
2
Beds
2
Baths
816
Sq Ft
$1,231/Sq Ft
Est. Value
About This Home
This home is located at 2811 8th St, Berkeley, CA 94710 and is currently estimated at $1,004,892, approximately $1,231 per square foot. 2811 8th St is a home located in Alameda County with nearby schools including Oxford Elementary School, Malcolm X Elementary School, and Washington Elementary School.
Ownership History
Date
Name
Owned For
Owner Type
Purchase Details
Closed on
Nov 2, 2004
Sold by
Massih Kaveh and Gonzalez Massih Judith L
Bought by
Massih Kaveh and Gonzalez Massih Judith L
Current Estimated Value
Purchase Details
Closed on
Jan 12, 1999
Sold by
Gonzalez Judy
Bought by
Massih Kava
Purchase Details
Closed on
Dec 21, 1993
Sold by
Bice Regan and Macarron Susana
Bought by
Massih Kaveh and Gonzalez Massih Judith L
Home Financials for this Owner
Home Financials are based on the most recent Mortgage that was taken out on this home.
Original Mortgage
$110,000
Interest Rate
7.2%
Create a Home Valuation Report for This Property
The Home Valuation Report is an in-depth analysis detailing your home's value as well as a comparison with similar homes in the area
Home Values in the Area
Average Home Value in this Area
Purchase History
| Date | Buyer | Sale Price | Title Company |
|---|---|---|---|
| Massih Kaveh | -- | -- | |
| Massih Kava | -- | Chicago Title Co | |
| Massih Kaveh | $55,000 | North American Title Company |
Source: Public Records
Mortgage History
| Date | Status | Borrower | Loan Amount |
|---|---|---|---|
| Closed | Massih Kaveh | $110,000 |
Source: Public Records
Tax History
| Year | Tax Paid | Tax Assessment Tax Assessment Total Assessment is a certain percentage of the fair market value that is determined by local assessors to be the total taxable value of land and additions on the property. | Land | Improvement |
|---|---|---|---|---|
| 2025 | $6,472 | $234,984 | $49,798 | $185,186 |
| 2024 | $6,472 | $230,378 | $48,822 | $181,556 |
| 2023 | $6,266 | $225,860 | $47,864 | $177,996 |
| 2022 | $6,266 | $221,432 | $46,926 | $174,506 |
| 2021 | $6,258 | $217,091 | $46,006 | $171,085 |
| 2020 | $5,875 | $214,865 | $45,534 | $169,331 |
| 2019 | $4,828 | $149,672 | $44,641 | $105,031 |
| 2018 | $4,686 | $146,738 | $43,766 | $102,972 |
| 2017 | $3,964 | $143,862 | $42,908 | $100,954 |
| 2016 | $3,809 | $141,041 | $42,067 | $98,974 |
| 2015 | $4,170 | $138,923 | $41,435 | $97,488 |
| 2014 | $4,095 | $136,203 | $40,624 | $95,579 |
Source: Public Records
Map
Nearby Homes
- 1010 Grayson St
- 1034 Grayson St
- 2751 Wallace St
- 1237 Ashby Ave
- 811 Folger Ave
- 2717 Mabel St
- 1092 Dwight Way
- 1118 Dwight Way
- 3032 Mabel St
- 1142 Dwight Way
- 1314 Ashby Ave
- 1144 Dwight Way
- 1080 67th St
- 2411 Sixth St
- 1200 65th St Unit 224
- 1200 65th St Unit 230
- 917 Channing Way
- 2341 9th St
- 6501 San Pablo Ave Unit 410
- 1039 Channing Way
Your Personal Tour Guide
Ask me questions while you tour the home.