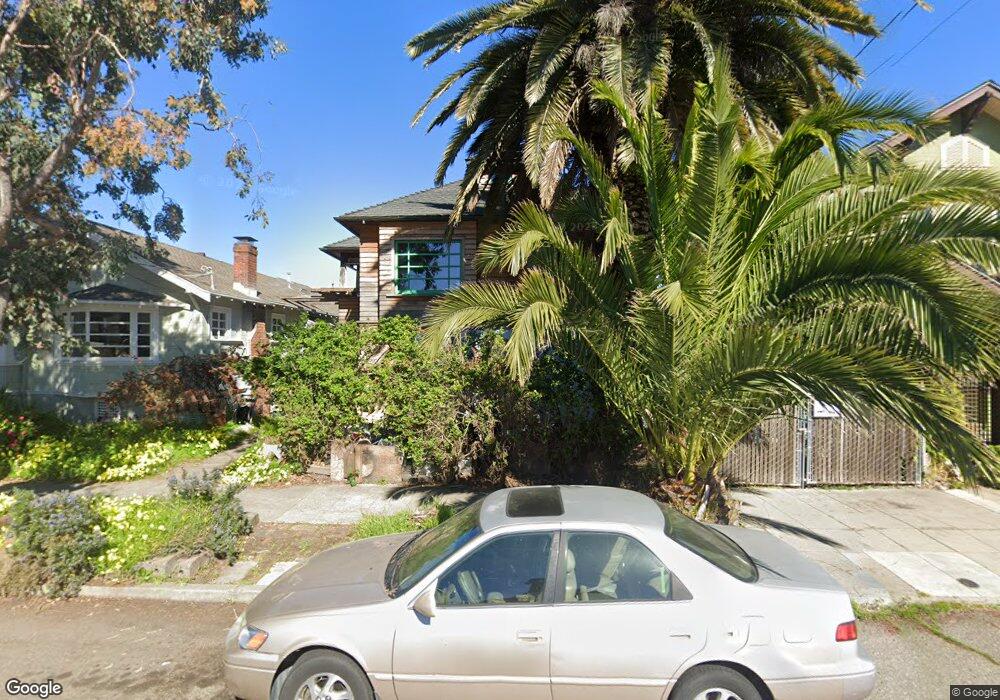
2811 9th St Berkeley, CA 94710
West Berkeley NeighborhoodEstimated Value: $754,000 - $1,222,000
2
Beds
1
Bath
736
Sq Ft
$1,245/Sq Ft
Est. Value
About This Home
This home is located at 2811 9th St, Berkeley, CA 94710 and is currently estimated at $916,295, approximately $1,244 per square foot. 2811 9th St is a home located in Alameda County with nearby schools including Malcolm X Elementary School, Oxford Elementary School, and Washington Elementary School.
Ownership History
Date
Name
Owned For
Owner Type
Purchase Details
Closed on
Nov 28, 2017
Sold by
Wagner G Barry
Bought by
Wagner George Barry and George Barry Wagner Trust
Current Estimated Value
Purchase Details
Closed on
Feb 4, 2000
Sold by
Holmes William Edward
Bought by
Wagner G Barry
Purchase Details
Closed on
Jan 28, 2000
Sold by
Lasagna Larry and Lasagna Carl
Bought by
Holmes William Edward
Purchase Details
Closed on
May 23, 1999
Sold by
Lasagna Larry and Lasagna Carl
Bought by
Holmes William Edward
Home Financials for this Owner
Home Financials are based on the most recent Mortgage that was taken out on this home.
Original Mortgage
$135,000
Interest Rate
6.84%
Purchase Details
Closed on
Nov 16, 1998
Sold by
Holmes William
Bought by
Lasagna Larry and Lasagna Carl
Purchase Details
Closed on
Aug 17, 1984
Sold by
Holmes August
Bought by
Holmes William
Create a Home Valuation Report for This Property
The Home Valuation Report is an in-depth analysis detailing your home's value as well as a comparison with similar homes in the area
Home Values in the Area
Average Home Value in this Area
Purchase History
| Date | Buyer | Sale Price | Title Company |
|---|---|---|---|
| Wagner George Barry | -- | None Available | |
| Wagner G Barry | $205,000 | -- | |
| Holmes William Edward | -- | -- | |
| Holmes William Edward | $183,000 | First American Title Guarant | |
| Lasagna Larry | $160,000 | Chicago Title Co | |
| Holmes William | -- | -- |
Source: Public Records
Mortgage History
| Date | Status | Borrower | Loan Amount |
|---|---|---|---|
| Previous Owner | Holmes William Edward | $135,000 |
Source: Public Records
Tax History
| Year | Tax Paid | Tax Assessment Tax Assessment Total Assessment is a certain percentage of the fair market value that is determined by local assessors to be the total taxable value of land and additions on the property. | Land | Improvement |
|---|---|---|---|---|
| 2025 | $9,165 | $419,682 | $169,057 | $250,625 |
| 2024 | $9,165 | $414,023 | $165,743 | $248,280 |
| 2023 | $8,975 | $408,474 | $162,494 | $245,980 |
| 2022 | $8,779 | $403,034 | $159,308 | $243,726 |
| 2021 | $8,790 | $397,702 | $156,185 | $241,517 |
| 2020 | $7,551 | $343,969 | $154,585 | $189,384 |
| 2019 | $6,617 | $285,794 | $151,554 | $134,240 |
| 2018 | $5,486 | $272,720 | $148,583 | $124,137 |
| 2017 | $5,201 | $261,746 | $145,670 | $116,076 |
| 2016 | $4,955 | $256,870 | $142,815 | $114,055 |
| 2015 | $4,719 | $240,208 | $140,670 | $99,538 |
| 2014 | $4,605 | $235,502 | $137,914 | $97,588 |
Source: Public Records
Map
Nearby Homes
- 1010 Grayson St
- 1034 Grayson St
- 2751 Wallace St
- 1237 Ashby Ave
- 2717 Mabel St
- 1092 Dwight Way
- 1118 Dwight Way
- 1142 Dwight Way
- 811 Folger Ave
- 1144 Dwight Way
- 1314 Ashby Ave
- 3032 Mabel St
- 1080 67th St
- 2411 Sixth St
- 1039 Channing Way
- 2922 Stanton St
- 2341 9th St
- 917 Channing Way
- 1200 65th St Unit 224
- 1200 65th St Unit 230
Your Personal Tour Guide
Ask me questions while you tour the home.