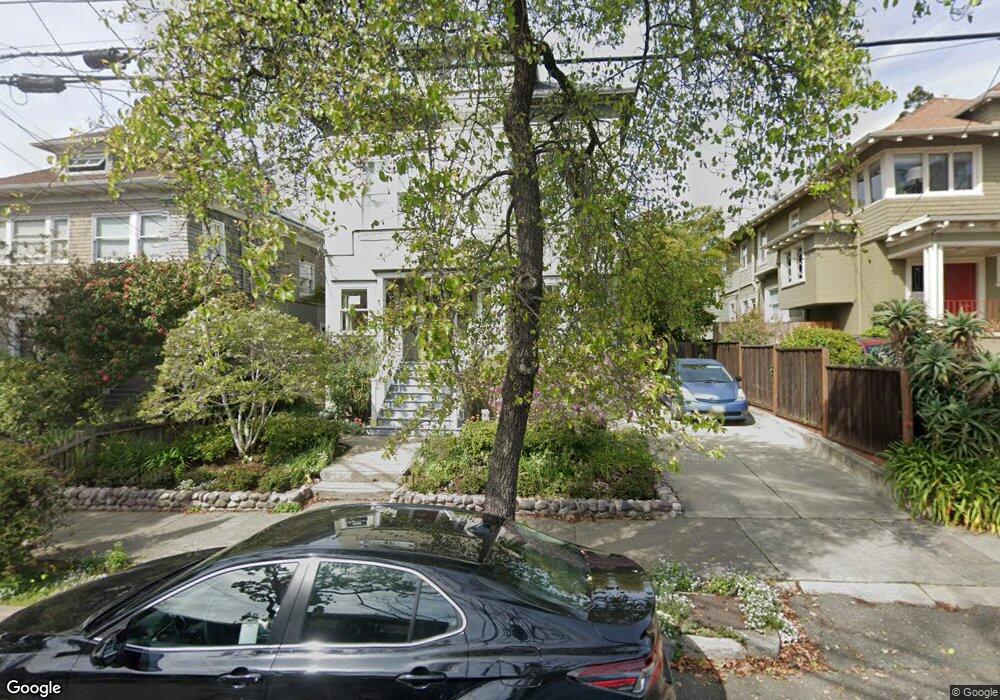
2811 Stuart St Unit 1 Berkeley, CA 94705
Claremont NeighborhoodEstimated Value: $1,497,000 - $1,998,000
5
Beds
4
Baths
2,867
Sq Ft
$624/Sq Ft
Est. Value
About This Home
This home is located at 2811 Stuart St Unit 1, Berkeley, CA 94705 and is currently estimated at $1,789,139, approximately $624 per square foot. 2811 Stuart St Unit 1 is a home located in Alameda County with nearby schools including Emerson Elementary School, John Muir Elementary School, and Malcolm X Elementary School.
Ownership History
Date
Name
Owned For
Owner Type
Purchase Details
Closed on
Dec 8, 2020
Sold by
Willis Lauren E and Weissglass Jonathan D
Bought by
Willis Lauren E and Weissglass Jonathan D
Current Estimated Value
Home Financials for this Owner
Home Financials are based on the most recent Mortgage that was taken out on this home.
Original Mortgage
$595,650
Outstanding Balance
$432,653
Interest Rate
2.73%
Mortgage Type
New Conventional
Estimated Equity
$1,356,486
Purchase Details
Closed on
Oct 14, 2011
Sold by
Willis Lauren Elizabeth and Weissglass Jonathan
Bought by
Willis Lauren E and Weissglass Jonathan D
Purchase Details
Closed on
Aug 18, 2009
Sold by
Grossman Jeffrey C and Moschandreas Katherine
Bought by
Willis Lauren Elizabeth and Weissglass Jonathan
Home Financials for this Owner
Home Financials are based on the most recent Mortgage that was taken out on this home.
Original Mortgage
$729,750
Interest Rate
5.17%
Mortgage Type
New Conventional
Create a Home Valuation Report for This Property
The Home Valuation Report is an in-depth analysis detailing your home's value as well as a comparison with similar homes in the area
Home Values in the Area
Average Home Value in this Area
Purchase History
| Date | Buyer | Sale Price | Title Company |
|---|---|---|---|
| Willis Lauren E | -- | Amrock Llc | |
| Willis Lauren E | -- | Amrock Llc | |
| Willis Lauren E | -- | None Available | |
| Willis Lauren Elizabeth | $1,150,000 | Placer Title Company |
Source: Public Records
Mortgage History
| Date | Status | Borrower | Loan Amount |
|---|---|---|---|
| Open | Willis Lauren E | $595,650 | |
| Closed | Willis Lauren Elizabeth | $729,750 |
Source: Public Records
Tax History
| Year | Tax Paid | Tax Assessment Tax Assessment Total Assessment is a certain percentage of the fair market value that is determined by local assessors to be the total taxable value of land and additions on the property. | Land | Improvement |
|---|---|---|---|---|
| 2025 | $22,147 | $1,477,338 | $445,301 | $1,039,037 |
| 2024 | $22,147 | $1,448,244 | $436,573 | $1,018,671 |
| 2023 | $21,695 | $1,426,712 | $428,013 | $998,699 |
| 2022 | $21,317 | $1,391,744 | $419,623 | $979,121 |
| 2021 | $21,380 | $1,364,328 | $411,398 | $959,930 |
| 2020 | $20,230 | $1,357,275 | $407,182 | $950,093 |
| 2019 | $19,438 | $1,330,664 | $399,199 | $931,465 |
| 2018 | $19,120 | $1,304,582 | $391,374 | $913,208 |
| 2017 | $18,490 | $1,279,006 | $383,702 | $895,304 |
| 2016 | $17,910 | $1,253,936 | $376,181 | $877,755 |
| 2015 | $17,673 | $1,235,111 | $370,533 | $864,578 |
| 2014 | $17,553 | $1,210,926 | $363,278 | $847,648 |
Source: Public Records
Map
Nearby Homes
- 2817 Palm Ct
- 2632 Warring St Unit 3
- 2643 Stuart St
- 2962 Piedmont Ave
- 2601 College Ave Unit 203
- 2601 College Ave Unit 208
- 190 Stonewall Rd
- 2935 Florence St
- 2477 Prince St
- 2917 Telegraph Ave
- 2702 Dana St
- 2535 Chilton Way
- 641 Alvarado Rd
- 2509 Dwight Way
- 6446 Colby St
- 2 Gravatt Dr
- 0 Gravatt Dr Unit 41122154
- 2319 Ward St
- 161 Panoramic Way
- 2 Panoramic Way Unit 105
- 2811 Stuart St Unit 2
- 2813 Stuart St
- 2815 Stuart St
- 2809 Stuart St
- 2753 Piedmont Ave
- 2805 Stuart St
- 2816 Garber St
- 2812 Garber St
- 2823 Palm Ct
- 2808 Garber St
- 2820 Garber St
- 2802 Garber St
- 2800 Kelsey St
- 2805 Kelsey St
- 2806 Stuart St
- 2825 Palm Ct
- 2822 Garber St
- 2804 Stuart St
- 2800 Garber St
- 2804 Kelsey St
Your Personal Tour Guide
Ask me questions while you tour the home.