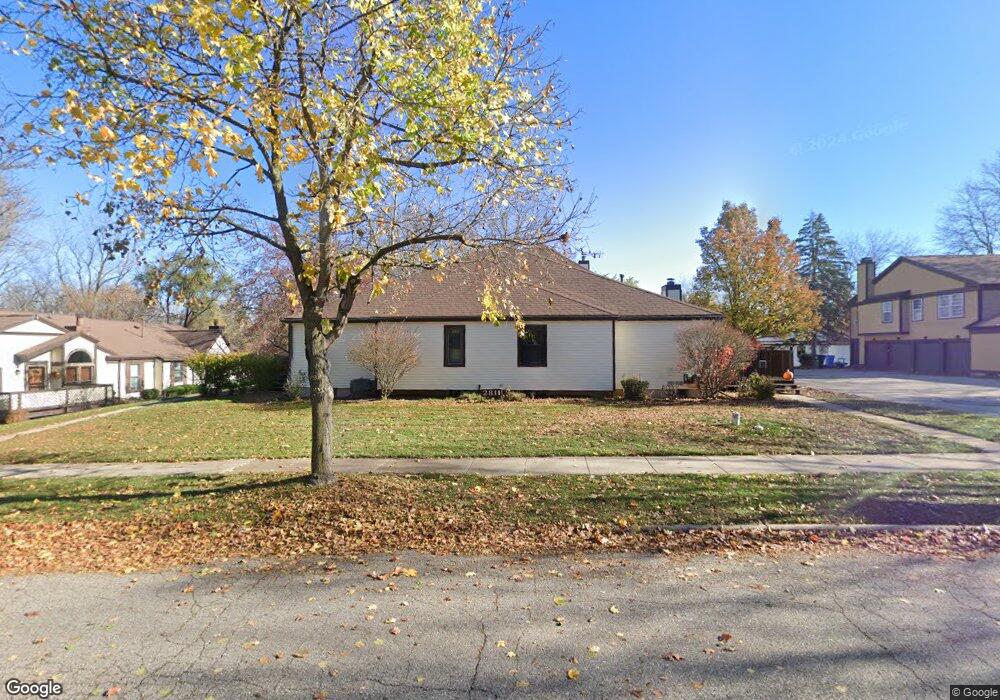
2811 Trudy Ln Unit 3 9 Lansing, MI 48910
Forest View NeighborhoodEstimated Value: $126,000 - $170,000
--
Bed
2
Baths
948
Sq Ft
$157/Sq Ft
Est. Value
About This Home
This home is located at 2811 Trudy Ln Unit 3 9, Lansing, MI 48910 and is currently estimated at $148,940, approximately $157 per square foot. 2811 Trudy Ln Unit 3 9 is a home located in Ingham County with nearby schools including Forest View School, Pattengill Academy, and Eastern High School.
Ownership History
Date
Name
Owned For
Owner Type
Purchase Details
Closed on
Jul 13, 2018
Sold by
Patrick R Snyder
Bought by
Martinson Blake and Martinson Thomas
Current Estimated Value
Home Financials for this Owner
Home Financials are based on the most recent Mortgage that was taken out on this home.
Original Mortgage
$52,040
Outstanding Balance
$45,130
Interest Rate
4.53%
Estimated Equity
$103,810
Purchase Details
Closed on
Feb 3, 2015
Sold by
Kasali Olajide B and Kasali Feyisola O
Bought by
Snyder Patrick R
Purchase Details
Closed on
May 24, 2001
Sold by
Stanzel Elizabeth
Bought by
Kasali Olajide B and Kasali Fayisola O
Home Financials for this Owner
Home Financials are based on the most recent Mortgage that was taken out on this home.
Original Mortgage
$96,900
Interest Rate
7.18%
Mortgage Type
Purchase Money Mortgage
Purchase Details
Closed on
Jun 1, 1995
Sold by
Swift Dawn M
Bought by
Stan Zel Lemuel A and Stan Elizabeth
Create a Home Valuation Report for This Property
The Home Valuation Report is an in-depth analysis detailing your home's value as well as a comparison with similar homes in the area
Home Values in the Area
Average Home Value in this Area
Purchase History
| Date | Buyer | Sale Price | Title Company |
|---|---|---|---|
| Martinson Blake | $53,000 | -- | |
| Snyder Patrick R | $55,000 | Liberty Title | |
| Kasali Olajide B | $96,900 | -- | |
| Kasali Babafunmilayo Abisola | -- | -- | |
| Stan Zel Lemuel A | $74,900 | -- |
Source: Public Records
Mortgage History
| Date | Status | Borrower | Loan Amount |
|---|---|---|---|
| Open | Martinson Blake | $52,040 | |
| Closed | Martinson Blake | -- | |
| Previous Owner | Kasali Olajide B | $96,900 |
Source: Public Records
Tax History Compared to Growth
Tax History
| Year | Tax Paid | Tax Assessment Tax Assessment Total Assessment is a certain percentage of the fair market value that is determined by local assessors to be the total taxable value of land and additions on the property. | Land | Improvement |
|---|---|---|---|---|
| 2025 | $2,691 | $63,100 | $5,000 | $58,100 |
| 2024 | $21 | $65,800 | $5,000 | $60,800 |
| 2023 | $2,524 | $56,800 | $5,000 | $51,800 |
| 2022 | $2,277 | $44,600 | $3,800 | $40,800 |
| 2021 | $2,229 | $41,000 | $5,000 | $36,000 |
| 2020 | $2,216 | $37,300 | $5,000 | $32,300 |
| 2019 | $2,123 | $34,800 | $5,000 | $29,800 |
| 2018 | $1,990 | $33,300 | $5,000 | $28,300 |
| 2017 | $1,905 | $33,300 | $5,000 | $28,300 |
| 2016 | $2,318 | $32,700 | $5,000 | $27,700 |
| 2015 | $2,318 | $32,300 | $10,000 | $22,300 |
| 2014 | $2,318 | $30,900 | $3,000 | $27,900 |
Source: Public Records
Map
Nearby Homes
- 2901 Staten Ave Unit 14
- 2626 Forest Rd
- 2505 Arbor Forest Dr Unit 11
- 2727 Aurora Dr
- 2528 Windbreak Ln Unit 13
- 3725 Stoneleigh Dr
- 2015 Forest Rd
- 3205 Aurelius Rd
- 2017 Greenwich Ct Unit 20
- 4207 Aurelius Rd
- 2237 Sunnyside Ave
- 2300 Sunnyside Ave
- 0 E Mount Hope Ave
- 2011 Clifton Ave
- 2018 Worden St
- 000 Dunckel Rd
- 1161 Rebecca Rd
- 2215 Alpha St
- 1620 Clifton Ave
- 3101 Plymouth Dr
- 2811 Trudy Ln Unit 11
- 2811 Trudy Ln Unit 9
- 2811 Trudy Ln Unit 12
- 2811 Trudy Ln Unit 10
- 2811 Trudy Ln
- 2812 Trudy Ln Unit 17
- 2812 Trudy Ln Unit 20
- 2812 Trudy Ln Unit 19
- 2812 Trudy Ln Unit 18
- 2812 Trudy Ln
- 2901 Staten Ave Unit 16
- 2901 Staten Ave Unit 13
- 2901 Staten Ave
- 2801 Trudy Ln Unit 7
- 2801 Trudy Ln Unit 8
- 2801 Trudy Ln Unit 9
- 2801 Trudy Ln
- 2925 Staten Ave Unit 6
- 2925 Staten Ave Unit 7
- 2925 Staten Ave Unit 5