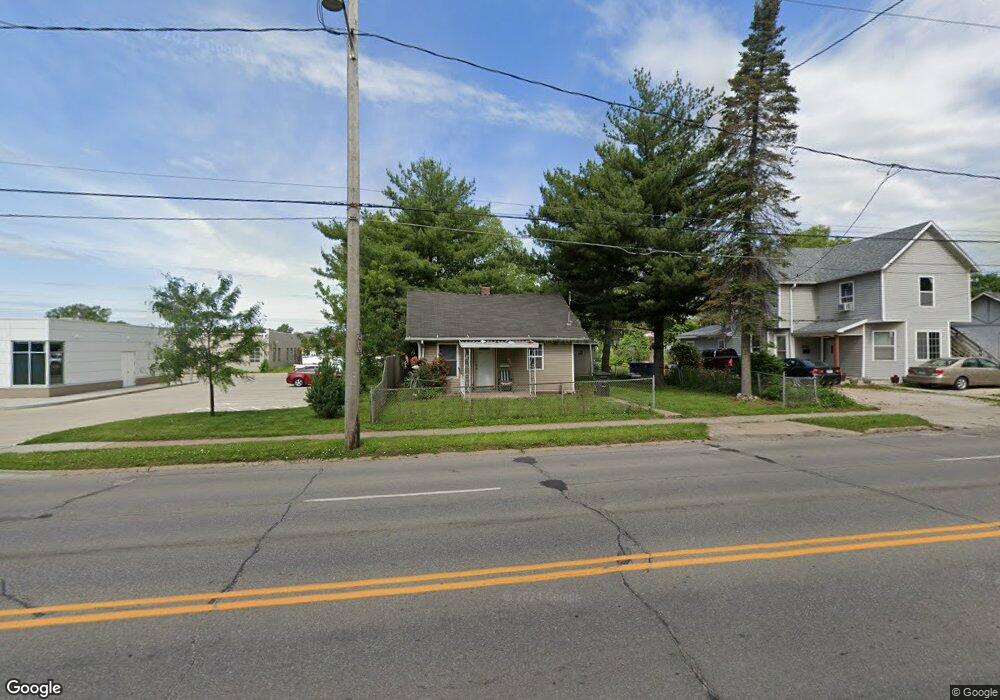
2812 2nd Ave Des Moines, IA 50313
Highland Park NeighborhoodEstimated Value: $111,227 - $137,000
1
Bed
1
Bath
744
Sq Ft
$166/Sq Ft
Est. Value
About This Home
This home is located at 2812 2nd Ave, Des Moines, IA 50313 and is currently estimated at $123,807, approximately $166 per square foot. 2812 2nd Ave is a home located in Polk County with nearby schools including Oak Park Elementary School, Harding Middle School, and North High School.
Ownership History
Date
Name
Owned For
Owner Type
Purchase Details
Closed on
Jul 15, 2025
Sold by
Gonzalez Gregorio Raya and Gonzalez Elizabeth Raya
Bought by
Ortiz Eliseo Raya
Current Estimated Value
Purchase Details
Closed on
Nov 6, 2017
Sold by
Raya Lidia Ortiz De
Bought by
Gonsales Gregorio Raya
Purchase Details
Closed on
Jun 11, 2013
Sold by
Ortiz Cristina R and Cerda Cristina R
Bought by
Deraya Lidia Ortiz
Purchase Details
Closed on
Jul 22, 2010
Sold by
Federal Home Loan Mortgage Corporation
Bought by
Cerda Cristina M
Purchase Details
Closed on
May 11, 2010
Sold by
Wells Fargo Bank Na
Bought by
Federal Home Loan Mortgage Corp
Purchase Details
Closed on
May 6, 2010
Sold by
Nguyen Tony Hoi and Nguyen Noanh Thi
Bought by
Wells Fargo Bank Na
Purchase Details
Closed on
Nov 15, 2000
Sold by
Grasso Cynthia A
Bought by
Nguyen Tony Hoi and Nguyen Hoanh Thi
Home Financials for this Owner
Home Financials are based on the most recent Mortgage that was taken out on this home.
Original Mortgage
$37,800
Interest Rate
7.87%
Create a Home Valuation Report for This Property
The Home Valuation Report is an in-depth analysis detailing your home's value as well as a comparison with similar homes in the area
Home Values in the Area
Average Home Value in this Area
Purchase History
| Date | Buyer | Sale Price | Title Company |
|---|---|---|---|
| Ortiz Eliseo Raya | -- | None Listed On Document | |
| Ortiz Eliseo Raya | -- | None Listed On Document | |
| Gonsales Gregorio Raya | -- | None Available | |
| Deraya Lidia Ortiz | -- | None Available | |
| Cerda Cristina M | -- | Servicelink | |
| Federal Home Loan Mortgage Corp | -- | None Available | |
| Wells Fargo Bank Na | $53,779 | None Available | |
| Nguyen Tony Hoi | $41,500 | -- |
Source: Public Records
Mortgage History
| Date | Status | Borrower | Loan Amount |
|---|---|---|---|
| Previous Owner | Nguyen Tony Hoi | $37,800 |
Source: Public Records
Tax History
| Year | Tax Paid | Tax Assessment Tax Assessment Total Assessment is a certain percentage of the fair market value that is determined by local assessors to be the total taxable value of land and additions on the property. | Land | Improvement |
|---|---|---|---|---|
| 2025 | $1,320 | $78,000 | $16,600 | $61,400 |
| 2024 | $1,320 | $67,100 | $14,200 | $52,900 |
| 2023 | $1,322 | $67,100 | $14,200 | $52,900 |
| 2022 | $1,312 | $56,100 | $12,400 | $43,700 |
| 2021 | $1,226 | $56,100 | $12,400 | $43,700 |
| 2020 | $1,272 | $49,100 | $10,800 | $38,300 |
| 2019 | $1,164 | $49,100 | $10,800 | $38,300 |
| 2018 | $1,152 | $43,300 | $9,400 | $33,900 |
| 2017 | $1,146 | $43,300 | $9,400 | $33,900 |
| 2016 | $1,118 | $42,400 | $9,200 | $33,200 |
| 2015 | $1,118 | $42,400 | $9,200 | $33,200 |
| 2014 | $1,232 | $46,400 | $9,900 | $36,500 |
Source: Public Records
Map
Nearby Homes
Your Personal Tour Guide
Ask me questions while you tour the home.