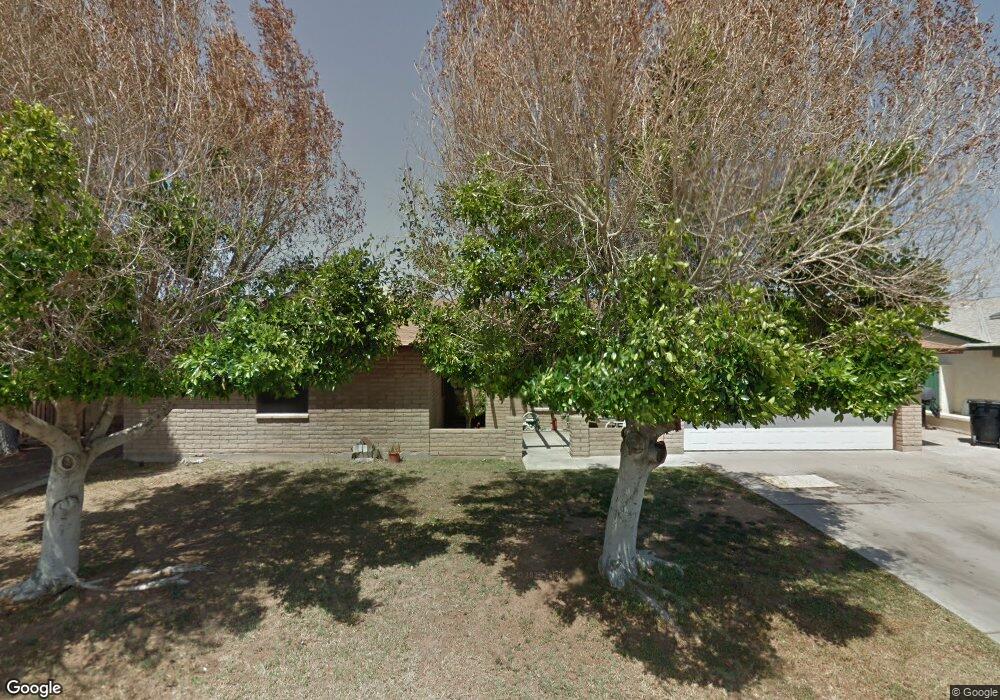
2812 E Gary St Mesa, AZ 85213
Citrus NeighborhoodEstimated Value: $526,237 - $720,000
4
Beds
3
Baths
2,216
Sq Ft
$268/Sq Ft
Est. Value
About This Home
This home is located at 2812 E Gary St, Mesa, AZ 85213 and is currently estimated at $594,559, approximately $268 per square foot. 2812 E Gary St is a home located in Maricopa County with nearby schools including Hale Elementary School, Franklin at Brimhall Elementary School, and Franklin West Elementary School.
Ownership History
Date
Name
Owned For
Owner Type
Purchase Details
Closed on
Aug 16, 2006
Sold by
Guzman Alma A and Milinkovich Daniel E
Bought by
Milinkovich Josefina C
Current Estimated Value
Purchase Details
Closed on
Mar 25, 1999
Sold by
Moeller Evalee Sue
Bought by
Guzman Alma A and Milinkovich Daniel E
Home Financials for this Owner
Home Financials are based on the most recent Mortgage that was taken out on this home.
Original Mortgage
$133,110
Interest Rate
6.73%
Mortgage Type
FHA
Purchase Details
Closed on
Sep 15, 1997
Sold by
Moeller Robert P
Bought by
Moeller Evalee Sue
Create a Home Valuation Report for This Property
The Home Valuation Report is an in-depth analysis detailing your home's value as well as a comparison with similar homes in the area
Home Values in the Area
Average Home Value in this Area
Purchase History
| Date | Buyer | Sale Price | Title Company |
|---|---|---|---|
| Milinkovich Josefina C | -- | Chicago Title Insurance Co | |
| Guzman Alma A | $134,000 | Chicago Title Insurance Co | |
| Milinkovich Daniel E | -- | Chicago Title Insurance Co | |
| Moeller Evalee Sue | -- | -- |
Source: Public Records
Mortgage History
| Date | Status | Borrower | Loan Amount |
|---|---|---|---|
| Previous Owner | Guzman Alma A | $133,110 |
Source: Public Records
Tax History
| Year | Tax Paid | Tax Assessment Tax Assessment Total Assessment is a certain percentage of the fair market value that is determined by local assessors to be the total taxable value of land and additions on the property. | Land | Improvement |
|---|---|---|---|---|
| 2025 | $1,958 | $23,574 | -- | -- |
| 2024 | $1,979 | $22,451 | -- | -- |
| 2023 | $1,979 | $36,310 | $7,260 | $29,050 |
| 2022 | $1,936 | $28,320 | $5,660 | $22,660 |
| 2021 | $1,989 | $26,620 | $5,320 | $21,300 |
| 2020 | $1,962 | $24,400 | $4,880 | $19,520 |
| 2019 | $1,818 | $22,410 | $4,480 | $17,930 |
| 2018 | $1,735 | $20,870 | $4,170 | $16,700 |
| 2017 | $1,681 | $21,500 | $4,300 | $17,200 |
| 2016 | $1,651 | $19,810 | $3,960 | $15,850 |
| 2015 | $1,558 | $18,350 | $3,670 | $14,680 |
Source: Public Records
Map
Nearby Homes
- 2848 E Brown Rd Unit 7
- 1449 N Los Alamos
- 3027 E Hope St
- 2517 E Highland St
- 2554 E Fox St
- 1222 N 25th St
- 3126 E Gary St
- 1456 N Gaylord Cir
- 2521 E Inca St
- 1312 N 24th St Unit 1
- 2511 E Fountain St
- 1511 N Loma Vista
- 2641 E Elmwood St
- 3041 E Backus Rd
- 824 N York Cir
- 2435 E Evergreen St
- 3342 E Fox St
- 1457 N Citrus Cove Cir
- 2325 E Elmwood St
- 3423 E Fairbrook St
- 2807 E Grandview Cir
- 2815 E Grandview Cir
- 2811 E Gary St
- 2828 E Gary St
- 2828 E Gary St
- 2819 E Gary St
- 2836 E Gary St
- 2810 E Glencove St
- 2825 E Grandview Cir
- 2818 E Glencove St
- 2808 E Grandview Cir
- 2816 E Grandview Cir
- 2826 E Grandview Cir
- 2848 E Gary St
- 2847 E Gary St
- 1354 N Roca
- 1346 N Roca
- 1362 N Roca
- 2813 E Huber St
- 2809 E Glencove St
Your Personal Tour Guide
Ask me questions while you tour the home.