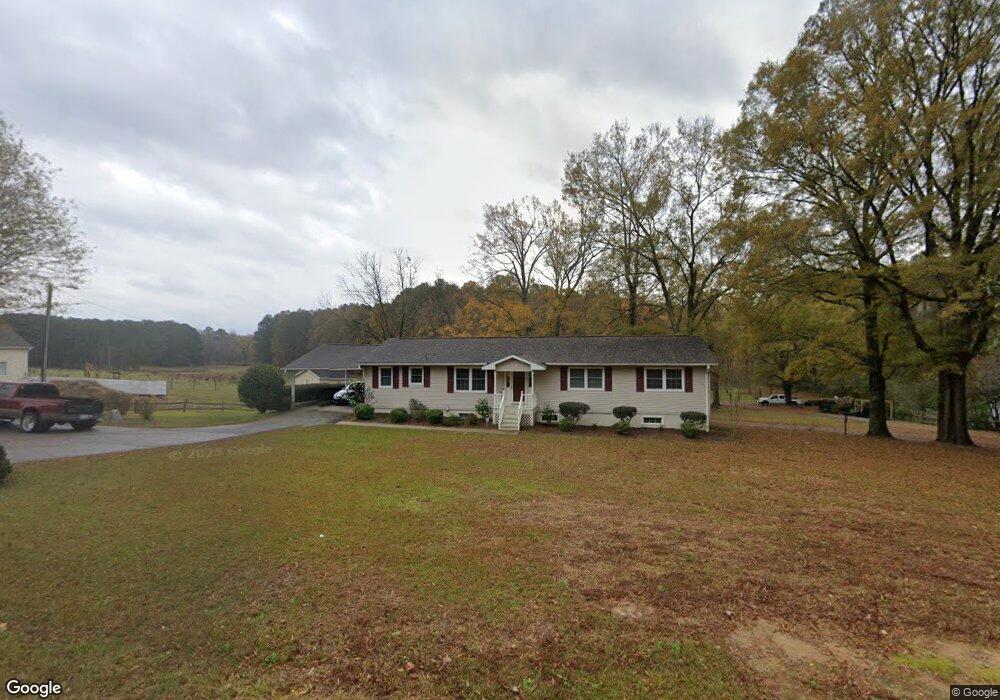
2813 Auburn Knightdale Rd Raleigh, NC 27610
Shotwell NeighborhoodEstimated Value: $402,000 - $592,000
3
Beds
2
Baths
2,964
Sq Ft
$158/Sq Ft
Est. Value
About This Home
This home is located at 2813 Auburn Knightdale Rd, Raleigh, NC 27610 and is currently estimated at $469,512, approximately $158 per square foot. 2813 Auburn Knightdale Rd is a home located in Wake County with nearby schools including Barwell Road Elementary School, Neuse River Middle School, and Knightdale High.
Ownership History
Date
Name
Owned For
Owner Type
Purchase Details
Closed on
Jul 19, 2006
Sold by
Weeks J Michael
Bought by
Kurney Ronald
Current Estimated Value
Home Financials for this Owner
Home Financials are based on the most recent Mortgage that was taken out on this home.
Original Mortgage
$143,900
Outstanding Balance
$88,455
Interest Rate
7.3%
Mortgage Type
Purchase Money Mortgage
Estimated Equity
$381,057
Purchase Details
Closed on
Jul 13, 2006
Sold by
Weeks J Michael and Bullock David W
Bought by
Weeks J Michael and Davids Trust
Home Financials for this Owner
Home Financials are based on the most recent Mortgage that was taken out on this home.
Original Mortgage
$143,900
Outstanding Balance
$88,455
Interest Rate
7.3%
Mortgage Type
Purchase Money Mortgage
Estimated Equity
$381,057
Purchase Details
Closed on
Aug 9, 2002
Sold by
Crouse Donna M Bullock and Crouse Michael T
Bought by
Weeks J Michael and Bullock David W
Create a Home Valuation Report for This Property
The Home Valuation Report is an in-depth analysis detailing your home's value as well as a comparison with similar homes in the area
Home Values in the Area
Average Home Value in this Area
Purchase History
| Date | Buyer | Sale Price | Title Company |
|---|---|---|---|
| Kurney Ronald | $180,000 | None Available | |
| Weeks J Michael | -- | None Available | |
| Weeks J Michael | -- | -- |
Source: Public Records
Mortgage History
| Date | Status | Borrower | Loan Amount |
|---|---|---|---|
| Open | Kurney Ronald | $143,900 |
Source: Public Records
Tax History Compared to Growth
Tax History
| Year | Tax Paid | Tax Assessment Tax Assessment Total Assessment is a certain percentage of the fair market value that is determined by local assessors to be the total taxable value of land and additions on the property. | Land | Improvement |
|---|---|---|---|---|
| 2025 | $2,318 | $359,233 | $88,960 | $270,273 |
| 2024 | $2,253 | $359,553 | $89,280 | $270,273 |
| 2023 | $1,419 | $179,386 | $43,540 | $135,846 |
| 2022 | $1,316 | $179,386 | $43,540 | $135,846 |
| 2021 | $1,281 | $179,386 | $43,540 | $135,846 |
| 2020 | $1,260 | $179,386 | $43,540 | $135,846 |
| 2019 | $1,275 | $153,626 | $38,960 | $114,666 |
| 2018 | $1,173 | $153,626 | $38,960 | $114,666 |
| 2017 | $1,112 | $153,626 | $38,960 | $114,666 |
| 2016 | $1,090 | $153,626 | $38,960 | $114,666 |
| 2015 | $1,205 | $170,608 | $41,280 | $129,328 |
| 2014 | $1,143 | $170,608 | $41,280 | $129,328 |
Source: Public Records
Map
Nearby Homes
- 1616 River Bend Ln
- 0 Battle Bridge Rd Unit 10126212
- 4217 Grahamstone Rd
- 3612 Griffice Mill Rd
- 7101 Battle Bridge Rd
- 131 English Violet Ln
- 4342 Bay Rum Ln
- 6420 Hatchies Dr
- 7002 Farmdale Rd
- 6863 Paint Rock Ln
- 2708 Hodge Rd
- 6005 Namozine Ct
- 3836 Griffis Glen Dr
- 6604 Frogstool Ln
- 2700 Barrington Dr
- 2601 Baxley Dr
- 1017 Harvest Mill Ct
- 6839 Harter Ct Unit 35
- 6839 Harter Ct
- 6520 Bunker Hill Dr
- 2805 Auburn Knightdale Rd
- 2824 Auburn Knightdale Rd
- 2816 Auburn Knightdale Rd
- 2832 Auburn Knightdale Rd
- 2808 Auburn Knightdale Rd
- 2828 Auburn Knightdale Rd
- 2846 Auburn Knightdale Rd
- 2732 Auburn Knightdale Rd
- 2720 Auburn Knightdale Rd
- 2716 Auburn Knightdale Rd
- 1700 Lone Holly Way
- 1704 Lone Holly Way
- 3821 La Costa Way
- 3817 La Costa Way
- 3813 La Costa Way
- 1708 Lone Holly Way
- 3809 La Costa Way
- 1716 Lone Holly Way
- 1701 Lone Holly Way
- Lt 199 Lone Holly Way