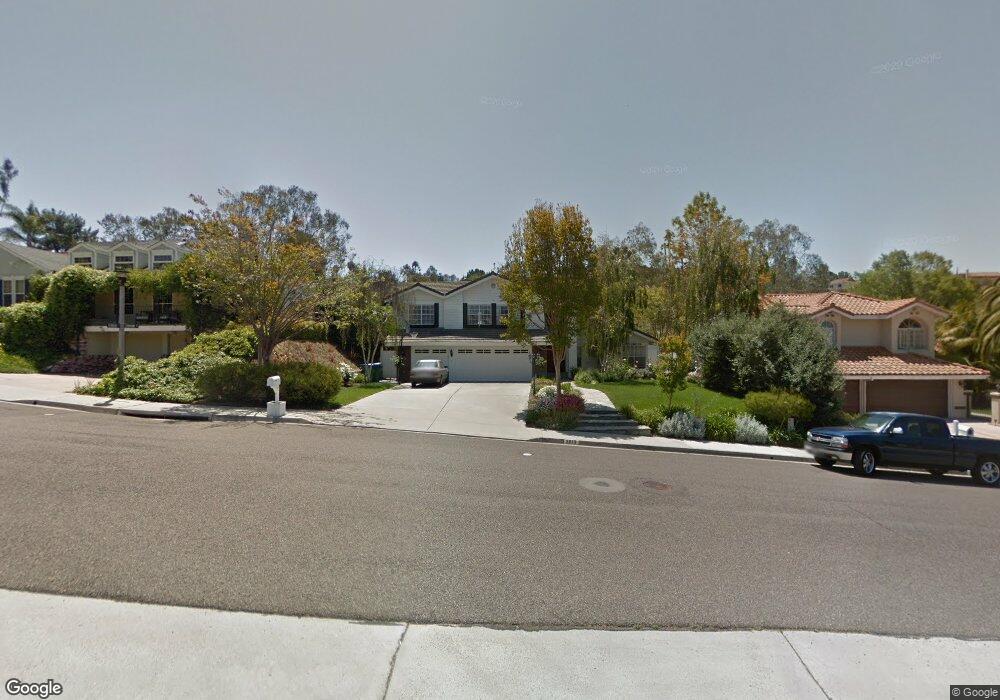
2813 Esturion St Carlsbad, CA 92009
La Costa NeighborhoodEstimated Value: $1,756,042 - $1,914,000
4
Beds
3
Baths
2,560
Sq Ft
$727/Sq Ft
Est. Value
About This Home
This home is located at 2813 Esturion St, Carlsbad, CA 92009 and is currently estimated at $1,862,261, approximately $727 per square foot. 2813 Esturion St is a home located in San Diego County with nearby schools including La Costa Meadows Elementary, San Elijo Middle School, and San Marcos High School.
Ownership History
Date
Name
Owned For
Owner Type
Purchase Details
Closed on
Apr 7, 2006
Sold by
Bubnack Ted and Bubnack Carolyn
Bought by
Gazzo Samuel C and Gazzo Jennifer A
Current Estimated Value
Home Financials for this Owner
Home Financials are based on the most recent Mortgage that was taken out on this home.
Original Mortgage
$82,000
Outstanding Balance
$64,621
Interest Rate
6.29%
Mortgage Type
Credit Line Revolving
Estimated Equity
$1,797,640
Purchase Details
Closed on
Jan 31, 2000
Sold by
Trust 05-25-93 Messano Frank P & Frances R In and Messano Frank P
Bought by
Bubnack Ted and Bubnack Carolyn
Home Financials for this Owner
Home Financials are based on the most recent Mortgage that was taken out on this home.
Original Mortgage
$333,600
Interest Rate
3.7%
Purchase Details
Closed on
Nov 8, 1983
Create a Home Valuation Report for This Property
The Home Valuation Report is an in-depth analysis detailing your home's value as well as a comparison with similar homes in the area
Home Values in the Area
Average Home Value in this Area
Purchase History
| Date | Buyer | Sale Price | Title Company |
|---|---|---|---|
| Gazzo Samuel C | $820,000 | Equity Title Company | |
| Bubnack Ted | $417,000 | Fidelity National Title Co | |
| -- | $160,000 | -- |
Source: Public Records
Mortgage History
| Date | Status | Borrower | Loan Amount |
|---|---|---|---|
| Open | Gazzo Samuel C | $82,000 | |
| Open | Gazzo Samuel C | $656,000 | |
| Previous Owner | Bubnack Ted | $333,600 |
Source: Public Records
Tax History Compared to Growth
Tax History
| Year | Tax Paid | Tax Assessment Tax Assessment Total Assessment is a certain percentage of the fair market value that is determined by local assessors to be the total taxable value of land and additions on the property. | Land | Improvement |
|---|---|---|---|---|
| 2025 | $12,155 | $1,120,512 | $683,240 | $437,272 |
| 2024 | $12,155 | $1,098,543 | $669,844 | $428,699 |
| 2023 | $11,931 | $1,077,004 | $656,710 | $420,294 |
| 2022 | $11,769 | $1,055,887 | $643,834 | $412,053 |
| 2021 | $11,574 | $1,035,184 | $631,210 | $403,974 |
| 2020 | $10,687 | $955,000 | $578,000 | $377,000 |
| 2019 | $10,496 | $930,000 | $563,000 | $367,000 |
| 2018 | $9,698 | $870,000 | $527,000 | $343,000 |
| 2017 | $9,365 | $840,000 | $509,000 | $331,000 |
| 2016 | $8,403 | $750,000 | $455,000 | $295,000 |
| 2015 | $7,848 | $700,000 | $425,000 | $275,000 |
| 2014 | $7,541 | $675,000 | $410,000 | $265,000 |
Source: Public Records
Map
Nearby Homes
- 2930 Rancho Cortes
- 6712 Cantil St
- 6844 Urubu St
- 6502 La Paloma St
- 6541 Vispera Place
- 2568 Abedul St
- 6417 Terraza Portico
- 6977 Corte Langosta
- 3137 Avenida Topanga
- 6691 Corte Eduardo
- 6817 Vianda Ct
- 6267 Via Trato
- 2515 Luciernaga St
- 6759 Paseo Del Vista
- 7133 Obelisco Cir
- 3223 Rancho Quartillo
- 7146 Argonauta Way
- 2610 Acuna Ct
- 6289 Citracado Cir
- 7215 El Fuerte St
- 2809 Esturion St
- 2819 Esturion St
- 2805 Esturion St
- 2825 Esturion St
- 2806 Esturion Ct
- 2818 Esturion Ct
- 2833 Esturion St
- 2801 Esturion St
- 2802 Esturion St
- 2822 Esturion Place
- 2841 Esturion St
- 2826 Esturion Place
- 2810 Esturion Ct
- 2814 Esturion Ct
- 6312 Chorlito St
- 4 lots El Fuerte
- 2848 Cacatua St
- 2849 Esturion St
- 6327 Chorlito St Unit 6327 Chorlito Street
- 2852 Cacatua St