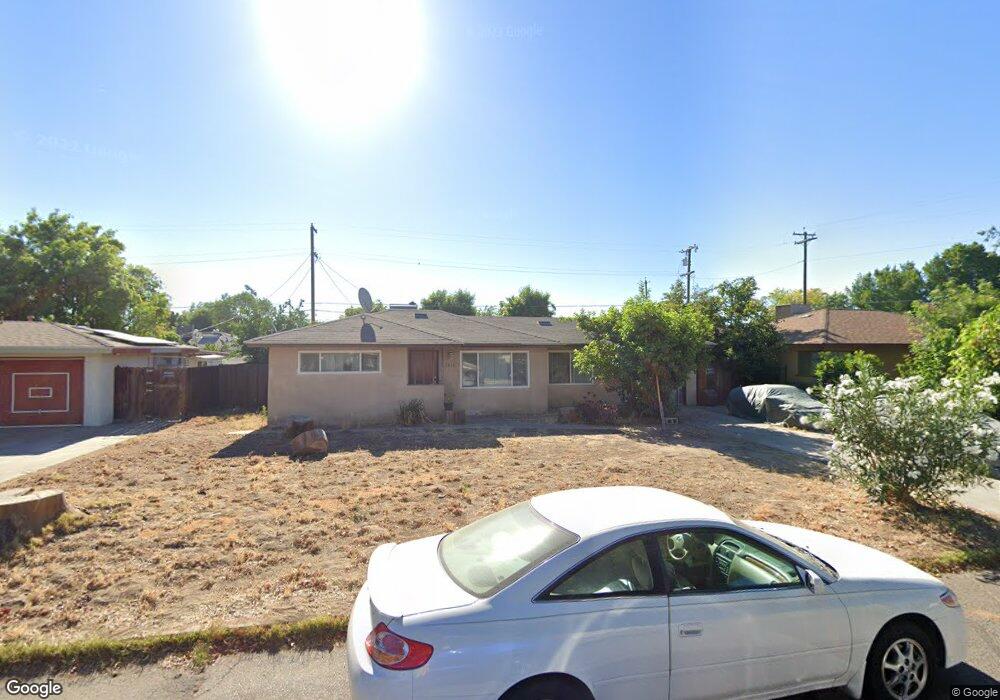
2814 N Boyd Ave Fresno, CA 93703
McLane NeighborhoodEstimated Value: $273,000 - $325,000
3
Beds
1
Bath
1,024
Sq Ft
$283/Sq Ft
Est. Value
About This Home
This home is located at 2814 N Boyd Ave, Fresno, CA 93703 and is currently estimated at $289,743, approximately $282 per square foot. 2814 N Boyd Ave is a home located in Fresno County with nearby schools including Norseman Elementary School, Scandinavian Middle School, and Mclane High School.
Ownership History
Date
Name
Owned For
Owner Type
Purchase Details
Closed on
Sep 27, 2024
Sold by
Thongsavath Phay
Bought by
Phay Thongsavath Revocable Living Trust
Current Estimated Value
Purchase Details
Closed on
Jan 12, 2022
Sold by
Claudia Ortega
Bought by
Ortega Claudia and Silva Jacob
Purchase Details
Closed on
Aug 18, 2008
Sold by
Thongsavath Amy N
Bought by
Thongsavath Phay and Thongsavath Chan Phaeng
Purchase Details
Closed on
Aug 28, 2006
Sold by
Thongsavath Phay and Thongsavath Chan Phaeng
Bought by
Thongsavath Amy N
Purchase Details
Closed on
Feb 17, 2000
Sold by
Palermo John J
Bought by
Thongsavath Phay and Thongsavath Chan Phaeng
Home Financials for this Owner
Home Financials are based on the most recent Mortgage that was taken out on this home.
Original Mortgage
$62,576
Interest Rate
8.34%
Mortgage Type
FHA
Create a Home Valuation Report for This Property
The Home Valuation Report is an in-depth analysis detailing your home's value as well as a comparison with similar homes in the area
Home Values in the Area
Average Home Value in this Area
Purchase History
| Date | Buyer | Sale Price | Title Company |
|---|---|---|---|
| Phay Thongsavath Revocable Living Trust | -- | None Listed On Document | |
| Ortega Claudia | -- | Philip M Flanigan | |
| Thongsavath Phay | -- | None Available | |
| Thongsavath Amy N | -- | None Available | |
| Thongsavath Phay | $66,500 | First American Title Co |
Source: Public Records
Mortgage History
| Date | Status | Borrower | Loan Amount |
|---|---|---|---|
| Previous Owner | Thongsavath Phay | $62,576 | |
| Closed | Thongsavath Phay | $2,785 |
Source: Public Records
Tax History Compared to Growth
Tax History
| Year | Tax Paid | Tax Assessment Tax Assessment Total Assessment is a certain percentage of the fair market value that is determined by local assessors to be the total taxable value of land and additions on the property. | Land | Improvement |
|---|---|---|---|---|
| 2025 | $1,289 | $102,182 | $30,727 | $71,455 |
| 2023 | $1,265 | $98,216 | $29,535 | $68,681 |
| 2022 | $1,248 | $96,291 | $28,956 | $67,335 |
| 2021 | $1,214 | $94,404 | $28,389 | $66,015 |
| 2020 | $1,209 | $93,437 | $28,098 | $65,339 |
| 2019 | $1,163 | $91,606 | $27,548 | $64,058 |
| 2018 | $1,138 | $89,810 | $27,008 | $62,802 |
| 2017 | $1,119 | $88,050 | $26,479 | $61,571 |
| 2016 | $1,082 | $86,324 | $25,960 | $60,364 |
| 2015 | $1,066 | $85,029 | $25,571 | $59,458 |
| 2014 | $1,046 | $83,365 | $25,071 | $58,294 |
Source: Public Records
Map
Nearby Homes
- 4454 E Simpson Ave
- 4625 E Princeton Ave
- 3926 E Fountain Way
- 2238 N Maple Ave
- 3803 E Shields Ave
- 4674 E Princeton Ave
- 3445 N 9th St
- 4597 E Cambridge Ave
- 3803 E Clinton Ave
- 4704 E Simpson Ave
- 2243 E Cambridge Ave
- 4054 Arden Dr S
- 4641 E Weldon Ave
- 4318 E Fairfax Ave
- 4617 E Garland Ave
- 4002 E Dakota Ave Unit 104
- 3645 E Cortland Ave
- 4747 E Clinton Ave
- 3646 E Dayton Ave
- 2824 N Boyd Ave
- 2804 N Boyd Ave
- 2813 N Rowell Ave
- 2823 N Rowell Ave
- 2803 N Rowell Ave
- 2834 N Boyd Ave
- 2817 N Boyd Ave
- 2833 N Rowell Ave
- 2807 N Boyd Ave
- 2827 N Boyd Ave
- 2844 N Boyd Ave
- 2837 N Boyd Ave
- 4309 E Brown Ave
- 2843 N Rowell Ave
- 4412 E Princeton Ave
- 2847 N Boyd Ave
- 2816 N Rowell Ave
- 2818 N Archie Ave
- 2904 N Boyd Ave
- 2826 N Rowell Ave