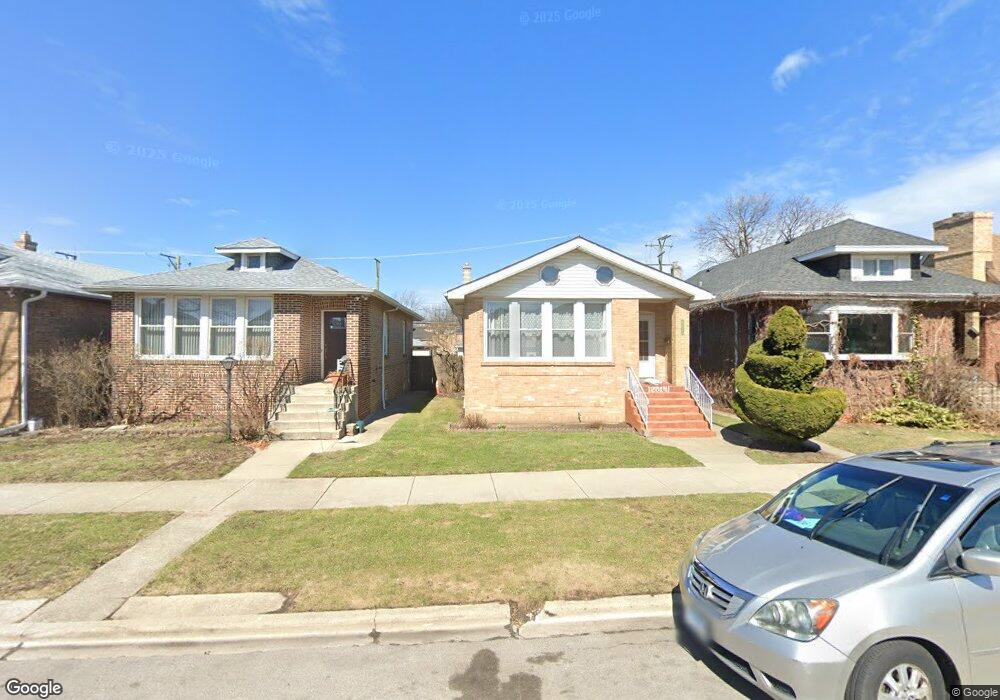
2814 W Fitch Ave Chicago, IL 60645
West Ridge NeighborhoodEstimated Value: $429,754 - $452,000
2
Beds
1
Bath
899
Sq Ft
$493/Sq Ft
Est. Value
About This Home
This home is located at 2814 W Fitch Ave, Chicago, IL 60645 and is currently estimated at $443,439, approximately $493 per square foot. 2814 W Fitch Ave is a home located in Cook County with nearby schools including Rogers Elementary School, Mather High School, and God's Battle Axe Prayer Academy.
Ownership History
Date
Name
Owned For
Owner Type
Purchase Details
Closed on
Oct 10, 2002
Sold by
Khan Nayyar Iftikhar Ahmad and Khan Melanie
Bought by
Ahang Jamila O and Ahang Madiha O
Current Estimated Value
Home Financials for this Owner
Home Financials are based on the most recent Mortgage that was taken out on this home.
Original Mortgage
$229,600
Outstanding Balance
$88,070
Interest Rate
5%
Estimated Equity
$355,369
Purchase Details
Closed on
Aug 2, 2002
Sold by
Ansari Ahsan
Bought by
Khan Nayyar Iftikhar Ahmad
Purchase Details
Closed on
Aug 13, 1998
Sold by
Roman Mario and Roman Delores
Bought by
Khan Iftikhar Ahmad and Khan Melanie
Home Financials for this Owner
Home Financials are based on the most recent Mortgage that was taken out on this home.
Original Mortgage
$150,400
Interest Rate
6.99%
Mortgage Type
Balloon
Create a Home Valuation Report for This Property
The Home Valuation Report is an in-depth analysis detailing your home's value as well as a comparison with similar homes in the area
Home Values in the Area
Average Home Value in this Area
Purchase History
| Date | Buyer | Sale Price | Title Company |
|---|---|---|---|
| Ahang Jamila O | $287,000 | -- | |
| Khan Nayyar Iftikhar Ahmad | -- | -- | |
| Khan Iftikhar Ahmad | $188,000 | Chicago Title Insurance Co |
Source: Public Records
Mortgage History
| Date | Status | Borrower | Loan Amount |
|---|---|---|---|
| Open | Ahang Jamila O | $229,600 | |
| Previous Owner | Khan Iftikhar Ahmad | $150,400 |
Source: Public Records
Tax History Compared to Growth
Tax History
| Year | Tax Paid | Tax Assessment Tax Assessment Total Assessment is a certain percentage of the fair market value that is determined by local assessors to be the total taxable value of land and additions on the property. | Land | Improvement |
|---|---|---|---|---|
| 2024 | $5,282 | $36,000 | $9,920 | $26,080 |
| 2023 | $5,110 | $31,000 | $7,936 | $23,064 |
| 2022 | $5,110 | $31,000 | $7,936 | $23,064 |
| 2021 | $5,028 | $31,000 | $7,936 | $23,064 |
| 2020 | $4,670 | $26,546 | $5,753 | $20,793 |
| 2019 | $4,719 | $29,660 | $5,753 | $23,907 |
| 2018 | $4,502 | $29,660 | $5,753 | $23,907 |
| 2017 | $3,756 | $23,525 | $5,158 | $18,367 |
| 2016 | $4,614 | $25,535 | $5,158 | $20,377 |
| 2015 | $4,198 | $25,535 | $5,158 | $20,377 |
| 2014 | $4,203 | $25,223 | $4,761 | $20,462 |
| 2013 | $4,109 | $25,223 | $4,761 | $20,462 |
Source: Public Records
Map
Nearby Homes
- 2650 W Touhy Ave
- 2626 W Lunt Ave
- 3112 W Wallen Ave
- 7061 N Kedzie Ave Unit 706
- 7061 N Kedzie Ave Unit 1008
- 2614 W Morse Ave
- 2545 W Coyle Ave
- 7141 N Kedzie Ave Unit 1502
- 7141 N Kedzie Ave Unit 406
- 7141 N Kedzie Ave Unit 1515
- 7141 N Kedzie Ave Unit 1209
- 7141 N Kedzie Ave Unit 403
- 3123 W Chase Ave
- 7249 N Campbell Ave Unit B
- 6800 N California Ave Unit 2M
- 6800 N California Ave Unit 3S
- 6800 N California Ave Unit 2I
- 2424 W Estes Ave Unit 1C
- 2424 W Estes Ave Unit 3B
- 7033 N Kedzie Ave Unit 1704
- 2810 W Fitch Ave
- 2818 W Fitch Ave
- 2808 W Fitch Ave
- 2822 W Fitch Ave
- 2804 W Fitch Ave
- 2824 W Fitch Ave
- 2826 W Fitch Ave
- 2800 W Fitch Ave
- 7156 N California Ave
- 2817 W Touhy Ave
- 2807 W Touhy Ave
- 2807 W Touhy Ave
- 2830 W Fitch Ave
- 2819 W Touhy Ave
- 2827 W Touhy Ave
- 2815 W Fitch Ave
- 2811 W Fitch Ave
- 2832 W Fitch Ave
- 2817 W Fitch Ave
- 2809 W Fitch Ave