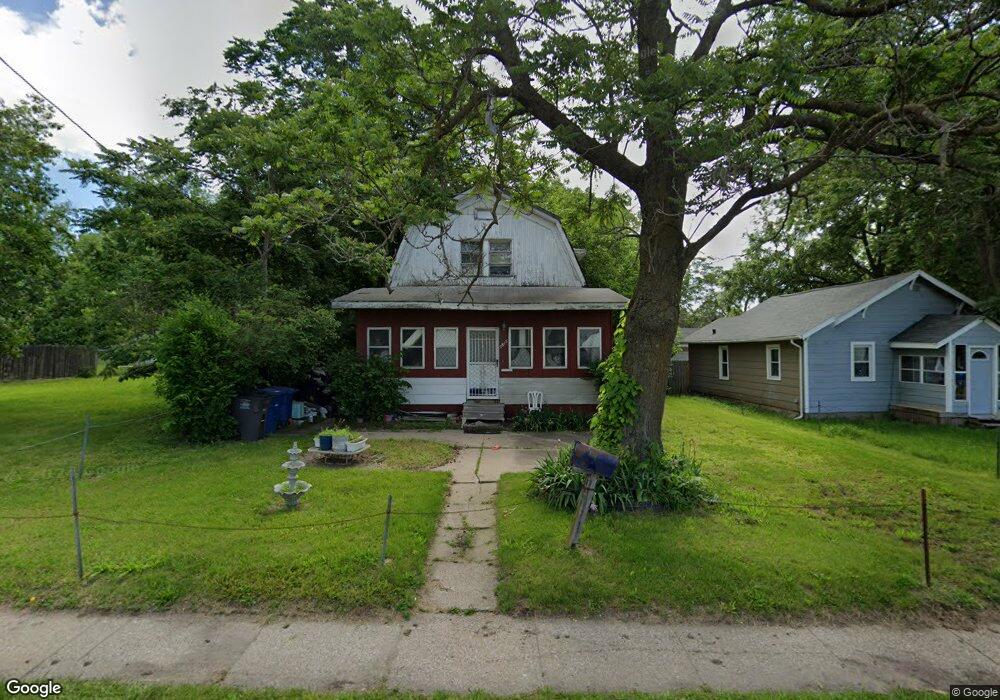
2815 2nd Ave Des Moines, IA 50313
Union Park NeighborhoodEstimated Value: $95,000 - $142,000
3
Beds
1
Bath
1,267
Sq Ft
$100/Sq Ft
Est. Value
About This Home
This home is located at 2815 2nd Ave, Des Moines, IA 50313 and is currently estimated at $126,621, approximately $99 per square foot. 2815 2nd Ave is a home located in Polk County with nearby schools including Findley Elementary School, Harding Middle School, and North High School.
Ownership History
Date
Name
Owned For
Owner Type
Purchase Details
Closed on
Sep 4, 2009
Sold by
Tenikat John
Bought by
Tenikat John and Tenikat Sheryl
Current Estimated Value
Purchase Details
Closed on
Mar 10, 2005
Sold by
Deutsche Bank Trust Co Americas
Bought by
Tenikat John and Tenikat Sheryl
Purchase Details
Closed on
Dec 22, 2004
Sold by
Barnes Cecile
Bought by
Mortgage Electronic Registration Systems
Purchase Details
Closed on
Dec 12, 2001
Sold by
Falkoski Diane A
Bought by
Barnes Cecile
Home Financials for this Owner
Home Financials are based on the most recent Mortgage that was taken out on this home.
Original Mortgage
$52,700
Interest Rate
11.28%
Purchase Details
Closed on
Aug 23, 2001
Sold by
Scieszinski John J
Bought by
Falkoski Diane A
Purchase Details
Closed on
Jul 1, 2001
Sold by
Scieszinski John J
Bought by
Falkoski Diane A
Purchase Details
Closed on
Feb 10, 2001
Sold by
Christensen Gary S and Christensen Patricia A
Bought by
Scieszinski John J
Create a Home Valuation Report for This Property
The Home Valuation Report is an in-depth analysis detailing your home's value as well as a comparison with similar homes in the area
Home Values in the Area
Average Home Value in this Area
Purchase History
| Date | Buyer | Sale Price | Title Company |
|---|---|---|---|
| Tenikat John | -- | None Available | |
| Tenikat John | $46,000 | Bankers & Lenders Title | |
| Deutsche Bank Trust Co Americas | -- | Bankers & Lenders Title | |
| Mortgage Electronic Registration Systems | $48,000 | -- | |
| Barnes Cecile | $58,500 | -- | |
| Falkoski Diane A | $39,500 | -- | |
| Falkoski Diane A | $40,000 | -- | |
| Scieszinski John J | $36,000 | -- |
Source: Public Records
Mortgage History
| Date | Status | Borrower | Loan Amount |
|---|---|---|---|
| Previous Owner | Barnes Cecile | $52,700 | |
| Closed | Falkoski Diane A | $0 |
Source: Public Records
Tax History Compared to Growth
Tax History
| Year | Tax Paid | Tax Assessment Tax Assessment Total Assessment is a certain percentage of the fair market value that is determined by local assessors to be the total taxable value of land and additions on the property. | Land | Improvement |
|---|---|---|---|---|
| 2025 | $1,498 | $108,300 | $19,100 | $89,200 |
| 2024 | $1,498 | $93,600 | $16,400 | $77,200 |
| 2023 | $986 | $93,600 | $16,400 | $77,200 |
| 2022 | $1,612 | $77,900 | $14,300 | $63,600 |
| 2021 | $804 | $77,900 | $14,300 | $63,600 |
| 2020 | $1,029 | $66,300 | $12,500 | $53,800 |
| 2019 | $1,360 | $66,300 | $12,500 | $53,800 |
| 2018 | $1,340 | $59,100 | $10,800 | $48,300 |
| 2017 | $1,330 | $59,100 | $10,800 | $48,300 |
| 2016 | $690 | $58,400 | $10,600 | $47,800 |
| 2015 | $690 | $58,400 | $10,600 | $47,800 |
| 2014 | $1,502 | $65,200 | $11,700 | $53,500 |
Source: Public Records
Map
Nearby Homes