2816 116th St Toledo, OH 43611
Point Place NeighborhoodEstimated Value: $152,743 - $190,000
4
Beds
2
Baths
1,755
Sq Ft
$97/Sq Ft
Est. Value
About This Home
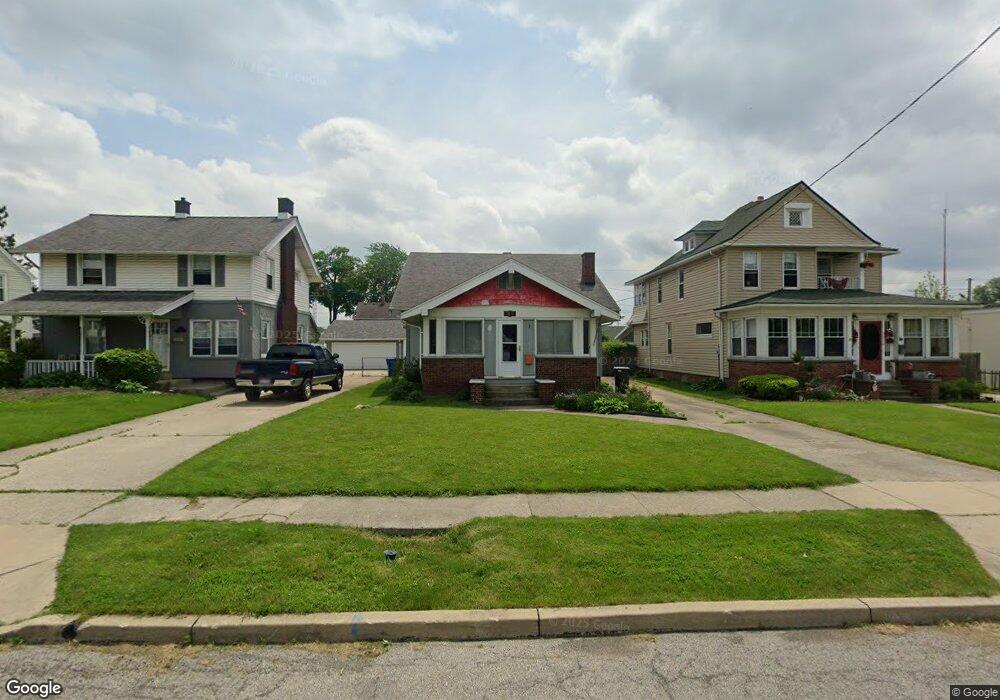
This home is located at 2816 116th St, Toledo, OH 43611 and is currently estimated at $170,936, approximately $97 per square foot. 2816 116th St is a home located in Lucas County with nearby schools including Ottawa River Elementary School, Woodward High School, and Imagine Environmental Science Academy.
Ownership History
Date
Name
Owned For
Owner Type
Purchase Details
Closed on
Mar 5, 2009
Sold by
Fraley Wendy and Combs Clinton
Bought by
Laytart David M
Current Estimated Value
Purchase Details
Closed on
Sep 17, 2004
Sold by
Arellano Robert and Arellano Madonna J
Bought by
Laytart David M and Fraley Wendy
Home Financials for this Owner
Home Financials are based on the most recent Mortgage that was taken out on this home.
Original Mortgage
$114,500
Interest Rate
6.88%
Mortgage Type
Purchase Money Mortgage
Purchase Details
Closed on
Jun 18, 1991
Sold by
Mohr Phillip L and Mohr Karen
Create a Home Valuation Report for This Property
The Home Valuation Report is an in-depth analysis detailing your home's value as well as a comparison with similar homes in the area
Home Values in the Area
Average Home Value in this Area
Purchase History
| Date | Buyer | Sale Price | Title Company |
|---|---|---|---|
| Laytart David M | -- | Attorney | |
| Laytart David M | $114,500 | Liberty Title Inc | |
| -- | $65,000 | -- |
Source: Public Records
Mortgage History
| Date | Status | Borrower | Loan Amount |
|---|---|---|---|
| Previous Owner | Laytart David M | $114,500 |
Source: Public Records
Tax History
| Year | Tax Paid | Tax Assessment Tax Assessment Total Assessment is a certain percentage of the fair market value that is determined by local assessors to be the total taxable value of land and additions on the property. | Land | Improvement |
|---|---|---|---|---|
| 2025 | -- | $34,475 | $6,790 | $27,685 |
| 2024 | $1,074 | $34,475 | $6,790 | $27,685 |
| 2023 | $1,849 | $28,175 | $6,160 | $22,015 |
| 2022 | $1,850 | $28,175 | $6,160 | $22,015 |
| 2021 | $1,894 | $28,175 | $6,160 | $22,015 |
| 2020 | $1,784 | $23,310 | $5,110 | $18,200 |
| 2019 | $1,735 | $23,310 | $5,110 | $18,200 |
| 2018 | $1,776 | $23,310 | $5,110 | $18,200 |
| 2017 | $1,869 | $23,905 | $5,145 | $18,760 |
| 2016 | $1,826 | $68,300 | $14,700 | $53,600 |
| 2015 | $1,810 | $68,300 | $14,700 | $53,600 |
| 2014 | $1,506 | $23,910 | $5,150 | $18,760 |
| 2013 | $1,506 | $23,910 | $5,150 | $18,760 |
Source: Public Records
Map
Nearby Homes