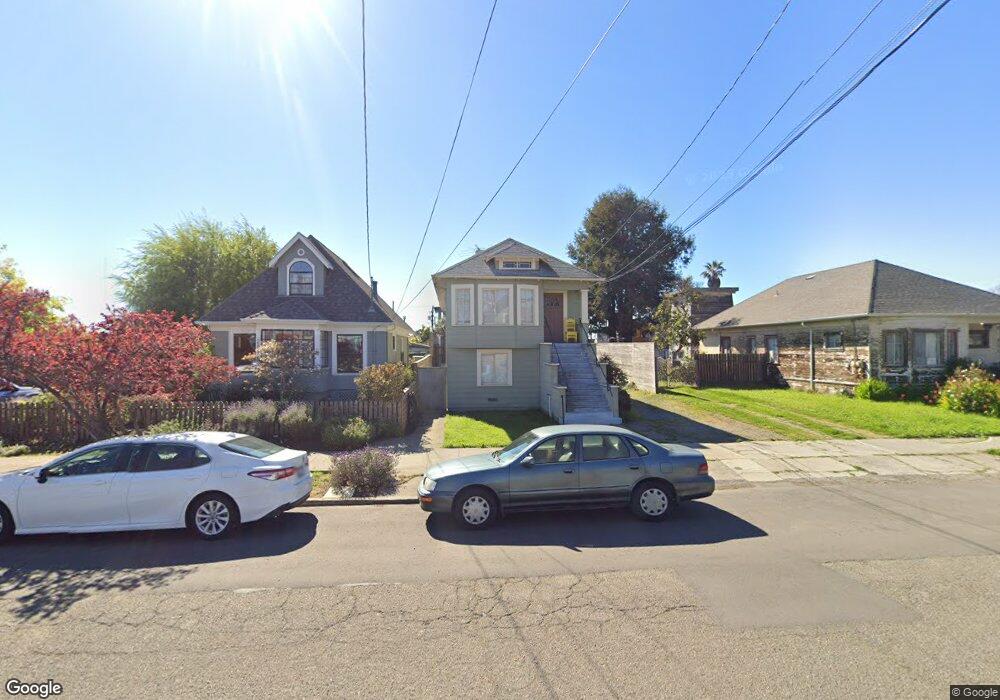
2816 9th St Berkeley, CA 94710
West Berkeley NeighborhoodEstimated Value: $973,000 - $1,489,000
4
Beds
1
Bath
1,719
Sq Ft
$672/Sq Ft
Est. Value
About This Home
This home is located at 2816 9th St, Berkeley, CA 94710 and is currently estimated at $1,154,353, approximately $671 per square foot. 2816 9th St is a home located in Alameda County with nearby schools including Malcolm X Elementary School, Oxford Elementary School, and Washington Elementary School.
Ownership History
Date
Name
Owned For
Owner Type
Purchase Details
Closed on
Sep 21, 2016
Sold by
Craig Donald H and Craig Andrea
Bought by
Craig Donald H and Craig Andrea D
Current Estimated Value
Purchase Details
Closed on
Jul 24, 2012
Sold by
Craig Donald H
Bought by
Craig Donald H and Craig Andrea
Home Financials for this Owner
Home Financials are based on the most recent Mortgage that was taken out on this home.
Original Mortgage
$170,000
Outstanding Balance
$117,070
Interest Rate
3.62%
Mortgage Type
New Conventional
Estimated Equity
$1,037,283
Purchase Details
Closed on
Mar 10, 1999
Sold by
Craig Donald H and Craig Peggie C
Bought by
Craig Donald H
Home Financials for this Owner
Home Financials are based on the most recent Mortgage that was taken out on this home.
Original Mortgage
$145,330
Interest Rate
6.7%
Mortgage Type
Seller Take Back
Create a Home Valuation Report for This Property
The Home Valuation Report is an in-depth analysis detailing your home's value as well as a comparison with similar homes in the area
Home Values in the Area
Average Home Value in this Area
Purchase History
| Date | Buyer | Sale Price | Title Company |
|---|---|---|---|
| Craig Donald H | -- | None Available | |
| Craig Donald H | -- | None Available | |
| Craig Donald H | $145,500 | -- | |
| Craig Donald H | -- | -- |
Source: Public Records
Mortgage History
| Date | Status | Borrower | Loan Amount |
|---|---|---|---|
| Open | Craig Donald H | $170,000 | |
| Closed | Craig Donald H | $145,330 |
Source: Public Records
Tax History
| Year | Tax Paid | Tax Assessment Tax Assessment Total Assessment is a certain percentage of the fair market value that is determined by local assessors to be the total taxable value of land and additions on the property. | Land | Improvement |
|---|---|---|---|---|
| 2025 | $5,010 | $103,478 | $60,935 | $42,543 |
| 2024 | $5,010 | $101,450 | $59,741 | $41,709 |
| 2023 | $4,809 | $99,460 | $58,569 | $40,891 |
| 2022 | $4,586 | $97,510 | $57,421 | $40,089 |
| 2021 | $4,548 | $95,598 | $56,295 | $39,303 |
| 2020 | $4,157 | $94,618 | $55,718 | $38,900 |
| 2019 | $3,825 | $92,764 | $54,626 | $38,138 |
| 2018 | $3,711 | $90,945 | $53,555 | $37,390 |
| 2017 | $3,549 | $89,162 | $52,505 | $36,657 |
| 2016 | $3,310 | $87,413 | $51,475 | $35,938 |
| 2015 | $3,241 | $86,100 | $50,702 | $35,398 |
| 2014 | $3,116 | $84,414 | $49,709 | $34,705 |
Source: Public Records
Map
Nearby Homes
- 1010 Grayson St
- 1034 Grayson St
- 2751 Wallace St
- 1237 Ashby Ave
- 2717 Mabel St
- 1092 Dwight Way
- 1118 Dwight Way
- 1142 Dwight Way
- 811 Folger Ave
- 1144 Dwight Way
- 1314 Ashby Ave
- 3032 Mabel St
- 1080 67th St
- 2411 Sixth St
- 1039 Channing Way
- 2922 Stanton St
- 2341 9th St
- 917 Channing Way
- 1200 65th St Unit 224
- 1200 65th St Unit 230
Your Personal Tour Guide
Ask me questions while you tour the home.